
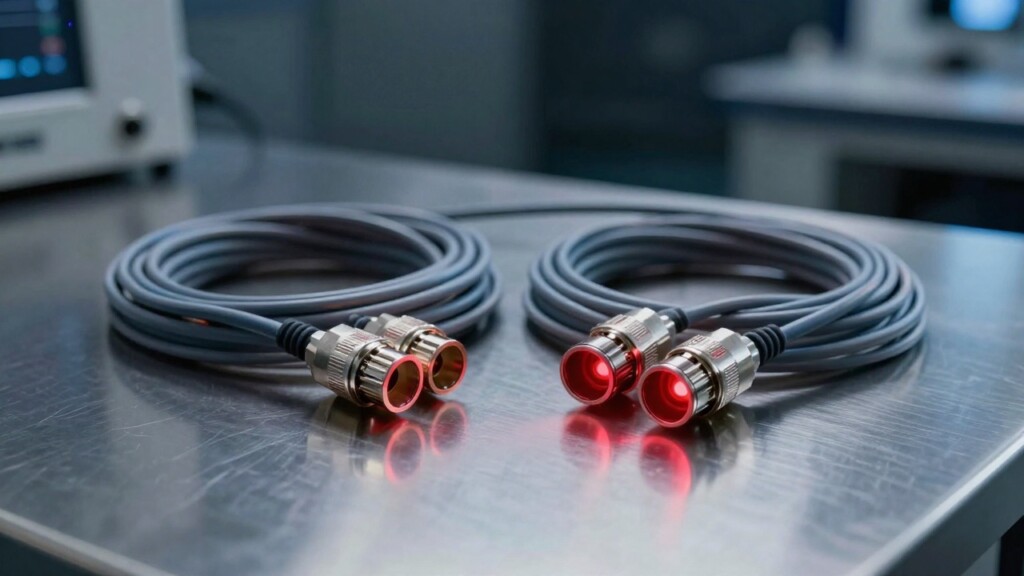
The choice of excitation wavelength is the first engineering decision when designing a process Raman measurement. It determines how strong the collected signal will be, how much fluorescence will be added to the background, which detector must be used — and ultimately, how much the system will cost. In process practice, we most often face the dilemma of 785 nm versus 1064 nm: two standard lines with very different risk profiles.
Across the entire Spectrally X1 family, we offer both standard excitation lines: 785 nm (600 mW) and 1064 nm (800 mW). 785 nm is the natural choice for most process applications, while we deliberately turn to 1064 nm when the sample's background fluorescence requires it. This article organizes the criteria for choosing between these two lines.
The physics of excitation — why wavelength matters
The Raman signal scales as the fourth power of the excitation frequency, i.e., inversely proportional to the fourth power of the wavelength. Practically speaking: at constant laser power and identical sample, 785 nm will yield approximately 3–3.5 times more Raman photons than 1064 nm. This is one of the main reasons why process Raman spectroscopy — which strives for short acquisition times and low noise levels — prefers shorter wavelengths.
On the other hand, shorter wavelengths more often hit the electronic absorption bands of the sample and excite fluorescence. Fluorescence is a much more intense phenomenon than Raman scattering (typically by several orders of magnitude) and can completely overwhelm the spectrum with a broad, smooth background. For many industrial samples — especially colored ones, containing chromophores, trace aromatic contaminants, or oxidation products — it is fluorescence, not detector noise, that is the main problem.
The choice of wavelength is therefore a compromise between two factors:
- Short wavelength — more signal, simpler optical path, but higher risk of fluorescence.
- Long wavelength — significantly less fluorescence, but weaker signal and a much more expensive detector.
785 nm — the process standard
785 nm is historically the most commonly chosen laser line for process and field Raman spectroscopy. It represents the „sweet spot” between signal and fluorescence for most inorganic and many organic samples. Features that explain this popularity:
- Laser availability and reliability — 785 nm semiconductor diodes are a mature technology, with good wavelength stability (typically on the order of 0.01 nm/°C in actively stabilized versions), long lifetime (thousands of hours), and power availability from tens of mW to several watts.
- Silicon CCD detector — for 785 nm excitation, the Raman signal from the fingerprint region falls in the range of 800–1010 nm, which is still within the good sensitivity range of thermoelectrically cooled silicon CCD arrays. This is an order of magnitude cheaper and simpler detector than the InGaAs required for 1064 nm.
- Long fiber optic paths — at 785 nm, the attenuation of standard silica optical fiber is low, allowing the measurement probe to be located tens of meters (typically up to 100 m) from the analyzer without significant signal loss.
- Compatibility with SERS — most commercial SERS substrates (resonant Au and Ag nanostructures) are optimized precisely for 785 nm.
The limitation of 785 nm remains fluorescence. Samples containing aromatic compounds, trace amounts of fluorophores (dyes, degradation products, raw material contaminants), or polymers additives and stabilizers can produce a background at 785 nm that is many times stronger than the Raman signal. For some such samples, fluorescence can be circumvented technologically (discussed below); for others, it cannot.
1064 nm — when fluorescence wins
1064 nm is a wavelength inherited from Nd:YAG lasers (historically the most popular for FT-Raman) and simultaneously a natural „escape route” from fluorescence:
- Photon energy below the excitation threshold of most fluorophores — organic chromophores have absorption bands mainly located in the UV and visible range; at NIR 1064 nm, most of them are not resonantly excited, so fluorescence is suppressed by orders of magnitude. This is invaluable for black, colored, contaminated samples, or those with strong absorption bands in the VIS/NIR.
- Reduced thermal effect — for samples strongly absorbing in the visible, 785 nm excitation can locally heat the medium (photothermal effect), affecting the spectrum and causing sample degradation. 1064 nm is gentler in this regard.
The cost of these gains is:
- Weaker signal — the 1/λ⁴ dependence means approximately 3× fewer Raman photons, so acquisition times increase correspondingly (typically 3–10× compared to 785 nm).
- Required InGaAs detector — silicon CCD is practically insensitive above approximately 1100 nm. An InGaAs array (thermoelectrically or liquid nitrogen cooled) must be used, which significantly increases the analyzer cost.
- More difficult spectral stability — narrow-linewidth, single-frequency 1064 nm lasers (DBR, single-frequency Nd:YAG) are more expensive and thermally demanding than 785 nm diodes.
- Shorter fiber optic distances — at 1064 nm, silica fiber attenuation is not a major issue, but the requirements for probe and path specifications are higher, and the practical operational length is often limited by SNR and cost considerations.
Conclusion: We choose 1064 nm when fluorescence at 785 nm cannot be circumvented by any more economical strategy, and the sample itself genuinely requires direct, not indirect, measurement.
Strategies for circumventing fluorescence without 1064 nm
Before resorting to 1064 nm — with all its cost overhead — it is worth considering cheaper approaches:
- Photobleaching — irradiating the sample before measurement for tens of seconds to a few minutes slightly reduces fluorescence due to the decay of some fluorophores. For some media, this is sufficient.
- SERS / SERRS — surface-enhanced Raman on Ag/Au substrates allows measuring concentrations in the ppm/ppb range with the same 785 nm excitation, with a significantly improved signal-to-background ratio. A dedicated technique, but it eliminates the problem in many trace applications.
- Time-gated Raman — synchronous measurement with picosecond laser pulses allows separating instantaneous Raman scattering from nanosecond-delayed fluorescence. Excellent results, but this is an expensive, highly specialized technology.
- Shifted-excitation Raman difference spectroscopy (SERDS) — measurement at two slightly different wavelengths and background subtraction. Works when the fluorescence is smooth and the Raman bands are sharp.
- Sample preparation — in extreme cases, dilution, filtration, extraction, or selecting a different measurement point in the process to avoid contaminated phases is a better solution than fighting fluorescence at the spectrometer level.
Only when none of the above approaches work — or when the business cost of a long measurement cycle with fluorescence is greater than the CAPEX of a 1064 nm system — do we resort to 1064 nm.
What else differentiates 785 nm and 1064 nm in process practice
| Parameter | 785 nm | 1064 nm |
|---|---|---|
| Relative Raman signal | ~1× (reference) | ~0.28× (≈1/3.5) |
| Fluorescence with typical organics | significant | minimal |
| Detector | TE-cooled silicon CCD | InGaAs (TE or LN2) |
| Detector cost ratio | 1× | typically several times higher |
| Wavelength stability | very good (DBR diodes) | good (Nd:YAG single-frequency) |
| Available vibrational range | ~150–3300 cm⁻¹ | limited by InGaAs (~150–3000 cm⁻¹) |
| Practical probe length | typically up to 100 m | typically up to several tens of meters |
| Compatibility with SERS | yes (standard) | rarely |
| Compatibility with FT-Raman | no | yes (classic) |
| Component availability | very high | moderate |
Decision matrix — which to choose for a specific process
In practice, we follow these questions in order:
- Does the sample produce strong fluorescence background at 785 nm?
- If NO → choose 785 nm. End of discussion.
- If YES → proceed to question 2.
- Can fluorescence be circumvented by indirect techniques (photobleaching, SERS, SERDS, sample preparation)?
- If YES → 785 nm + appropriate technique.
- If NO → question 3.
- Does the analyte have strong bands in the 200–1800 cm⁻¹ region (fingerprint), and is the concentration not trace-level?
- If YES and fluorescence at 785 nm dominates → consider 1064 nm.
- If NO (trace concentrations) → SERS at 785 nm usually wins in cost and signal performance.
- Does the process require a long fiber-optic probe (>30 m) and a remote electronics cabinet?
- If YES → 785 nm is preferred due to path attenuation and component maturity.
Typical applications for which 785 nm is the standard:
- monitoring polycondensation in phenol-formaldehyde and urea resin reactors,
- measurement of SLES, glycerin, and emulsion stability in production, cosmetics,,
- endpoint control of vinyl, acrylic, and silicone polymerization,
- verification of urea, biuret, RSM, AdBlue,
- raw material identification at the warehouse gate (incoming QC).
Typical applications where the argument for 1064 nm arises:
- black masses from lithium battery recycling,
- strongly colored petrochemical streams and refinery fractions with high aromatic content,
- certain engineering polymers with black pigments,
- biofuels with strong fluorescence background.
Gekko Photonics Solutions — 785 nm and 1064 nm in the Spectrally X1 Family
In Gekko Photonics, the Spectrally X1 family is available in two excitation variants: 785 nm (600 mW, the primary choice for most process chemistry) and 1064 nm (800 mW, for strongly fluorescent media — certain resins, dark petrochemical streams, recyclates containing black pigments). The specific wavelength is selected during the feasibility phase using customer samples, based on the actual level of background fluorescence. Both lines operate within the same chemometric platform, Spectrally OS, which simplifies model validation and calibration transfer between instruments.
Specifically:
- Spectrally X1 INLINE — Process analyzer with immersion probe Spectrally X1 PROBE (IP67, ATEX/IECEx Zone 0), laser 785 nm 600 mW or 1064 nm 800 mW (30 mW in ATEX version), spectral range 300–1650 cm⁻¹ or 300–3500 cm⁻¹, resolution 8 cm⁻¹, TE-cooled back-thinned CCD detector, communication PROFIBUS, PROFINET, GSM. The self-cleaning Retractex component maintains a clean optical window in challenging media (resins, viscous liquids, sediments).
- Spectrally X1 LAB i X1 LAB+ — Benchtop analyzer for chemometric model validation, raw material verification, and through-package analysis, with a 25-sample carousel, laser 785 nm 600 mW or 1064 nm 800 mW. The LAB+ variant includes a library of approximately 28,000 reference spectra in Spectrally OS.
- Spectrally X1 PORTABLE — Portable analyzer in a case for field raw material identification and reference measurements on the plant floor, IP54, standalone touchscreen, laser 785 nm 600 mW or 1064 nm 800 mW.
- Spectrally OS — common software layer for the entire family: spectral acquisition, chemometric models (PLS, PCA, CNN), library of ~28,000 reference spectra, integration with DCS/MES, model drift monitoring, and archiving.
For each process, we verify during the feasibility phase whether 785 nm is the right choice for the client's specific chemistry — using samples from the client's process, in our laboratory in Wrocław. If the result shows that the fluorescence problem cannot be circumvented by less expensive means, we state this directly and do not sell a system that will not work. The full offer is described in the section process analyzers.
What to choose when you are just starting
Three simple practical rules if you are organizing your first Raman measurements for a new process application:
- Start with 785 nm. It is the industry standard — the most resources (literature, models, probes, spectral libraries) are available there.
- Conduct a short feasibility study on real process samples. One day in the supplier's laboratory tells more than a month of theoretical discussions.
- Do not reserve CAPEX for 1064 nm „just in case.”. If it proves necessary — this follows from the feasibility study, which demonstrated that no cheaper approach would work.
If your process is adjacent to the topic discussed in our article on Raman analytics in lithium batteries, it is worth noting that even where 1064 nm is historically associated with black masses, the latest pathways involve multispectral resonant Raman with UV and deep-UV Raman, rather than merely selecting an NIR wavelength.
Test measurement and engineering consultation
The fastest way to answer the question „does my application realistically need 785 or 1064 nm” is to conduct a feasibility measurement on a sample from your process in our laboratory in Wrocław.
- A 30-minute conversation with an application engineer — we discuss the chemistry, process phases, analytical expectations, and potential fluorescence risks. After this, we determine whether we want to see your sample.
- Test measurement within 10 working days from sample delivery — We typically acquire a Raman spectrum at 785 nm and assess the fluorescence level; if a problem occurs, we propose switching to 1064 nm or an intermediate strategy (photobleaching, SERS, SERDS, sample preparation).
- Average implementation time: 3–5.5 months from workshop to an operational system on the production floor; typical ROI in the range of 6–10 months under industrial conditions.
Schedule a meeting via contact page. We accept samples in a glass vial, in original factory packaging, or via courier delivery to our laboratory in Wrocław.
Frequently asked questions
Can 785 nm be used for black samples?
Partially. Black materials strongly absorb in the visible and NIR range; at 785 nm, there is a risk of photothermal effects (local sample heating) and background arising from degradation. For each such sample, we begin with a laboratory assessment — sometimes 785 nm suffices with reduced laser power and appropriate beam movement or dispersion; at other times, 1064 nm or another technique (e.g., deep-UV) is genuinely required.
How does Gekko Photonics select 785 nm or 1064 nm for my application?
Both wavelengths are standardly available in the X1 INLINE / LAB / LAB+ / PORTABLE — 785 nm 600 mW and 1064 nm 800 mW. The decision is made during a feasibility cycle on real samples from the client's process: 785 nm is chosen for most process chemistry (higher Raman signal, mature probe and spectral library base), while 1064 nm is selected where background fluorescence at 785 nm dominates the signal and cannot be circumvented by intermediate techniques (photobleaching, SERS, SERDS, sample preparation). Both lines operate on the same Spectrally OS chemometric platform — the calibration model can be audited independently of the excitation wavelength.
Is 1064 nm „better” than 785 nm?
There is no such general category. 1064 nm is better where fluorescence at 785 nm completely dominates and the sample does not allow for indirect techniques. In every other scenario, 785 nm wins in terms of signal, cost, probe availability, and spectral library support.
What about other wavelengths — 532 nm, 405 nm, 1550 nm?
532 nm is occasionally used in resonant Raman for selected chromophores; 405 nm and deep UV are used in deep-UV Raman techniques for strong fluorescence suppression; 1550 nm is rare, for very specific media. These are technological niches — in industrial chemical and petrochemical practice, 785 nm and 1064 nm dominate.
Does the wavelength affect laser safety?
Yes. 785 nm and 1064 nm, in typical process configurations, correspond to laser classes 3B or 4 — requiring shielding, interlocks, and appropriate zone marking. 1064 nm is additionally invisible to the eye (below the vision threshold), which paradoxically increases the risk of unconscious exposure and requires more stringent workplace safety procedures.