
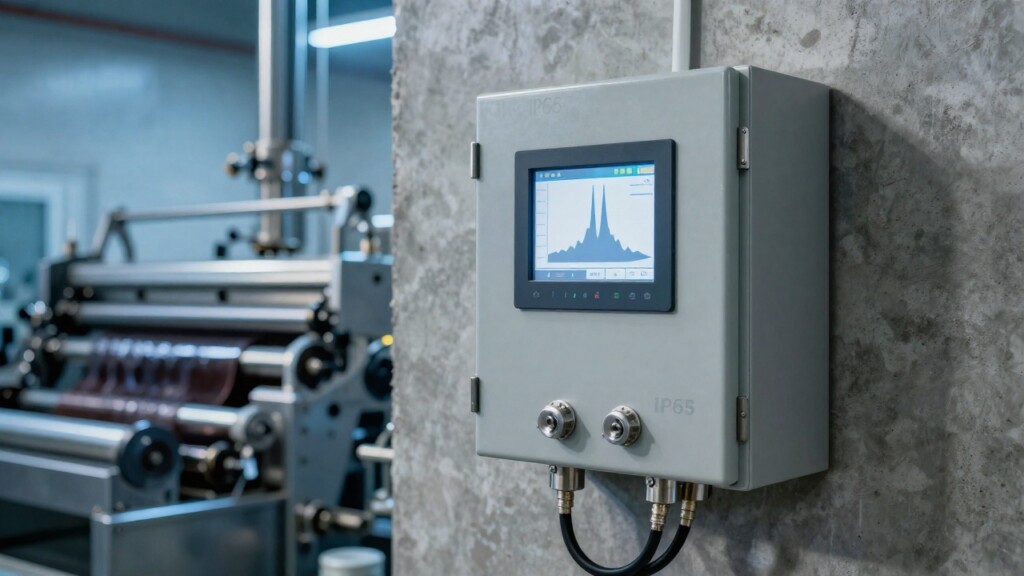
Raman spectroscopy in lithium-ion battery analytics is no longer solely a research tool and is entering cell production lines for measurements operando in cycled cells and for black mass recycling streams. Recent months have brought publications that organize what can realistically be measured today — and where it is worth placing a process probe, and where to remain in the laboratory.
We view these publications as a Polish manufacturer of Raman analyzers — although our implementation base is process chemistry (resins, hydrocarbons), not cell production. We enter battery analytics on a project basis: we verify in a feasibility cycle on client samples whether Raman is the appropriate method for a given material and stage, before anyone commits CAPEX. From this perspective, we assess which results from 2025–2026 are mature enough to translate into engineering decisions, and which still exist at the single-cell scale. Below is an overview of development directions and guidance on where process Raman genuinely makes sense in the lithium battery value chain., cosmetics, fertilizers, węglowodory), a nie produkcja ogniw. W analitykę baterii wchodzimy projektowo: na próbkach klienta sprawdzamy w cyklu feasibility, czy Raman jest właściwą metodą dla danego materiału i etapu, zanim ktokolwiek zaangażuje CAPEX. Z tej perspektywy oceniamy, które wyniki z 2025–2026 są dojrzałe na tyle, by przekładać je na decyzje inżynierskie, a które wciąż żyją w skali pojedynczego ogniwa. Poniżej przegląd kierunków rozwoju i wskazówki, gdzie Raman procesowy realnie ma sens w łańcuchu wartości baterii litowych.
Operando Raman in a cell — what we measure today
Measurement operando means collecting spectra during cell cycling, with the electrode and electrolyte under normal operating potential. The strongest publication line in recent months concerns layered cathodes (LNMO, NMC) and structural evolution during charging/discharging. Raman bands of the cathode shift in position and intensity in response to changes in the oxidation state of transition metals and cation ordering — this allows tracking degradation and inhomogeneity phenomena already within single cycles.
The second thread is the electrolyte. Operando Raman shows that in cycled cells with carbonate electrolyte, ethylene carbonate (EC) decomposes preferentially, and LiPF6 salt is gradually consumed — accompanied by the appearance of decomposition products (esters, alcohols). This is a tool for studying electrolyte chemistry aging under a real current profile, not only from the perspective of thermal acceleration.
The third, very active direction is hollow-core fiber optic probes introduced into the interior of the measurement cell. This architecture minimizes the fluorescence background and allows tracking changes in the solvent and additive ratio as a function of voltage, as well as lithium ion solvation — information that a single ex-situ laboratory spectrum cannot provide.
Silicon anode — Raman as a stress gauge
Silicon anodes and Si/C composites are among the most challenging areas: the enormous volume change during lithiation generates stresses that rupture the SEI layer and degrade cyclability. In-situ micro-Raman allows measuring stresses in Si nanoparticles through the shift of the first-order silicon band (~520 cm⁻¹). Publications from 2025 show a transition from tensile to compressive stresses during lithiation and an accumulation of residual stresses increasing with cycle number.
From a production perspective, this is still a research area — Raman as a stress gauge in the anode requires microscopic resolution and a single cell. On the production line scale, this is not an inline tool on entire rolls; it is an argument for the R&D laboratory working on the selection of chemical bonds in Si/C composites and on precursor quality.
Cell production line — where the process probe makes sense
On the production line, Raman enters three real areas: raw material control, electrode coating monitoring, and carbon coating analysis. Raman probes can non-contact characterize the surface of an electrode moving on a tape (coating + calendering), detecting inhomogeneities such as agglomerates, binder distribution disturbances, or deviations in component ratios. This allows faster response than in an offline-QC scheme once per roll.
For LFP, the structural carbon band (D ~1350 cm⁻¹ and G ~1600 cm⁻¹) is a practical indicator of carbon coating quality on LiFePO4 particles — the D/G intensity ratio informs about the degree of carbon ordering, which translates into electrical conductivity and rate capability. For NMC, Raman helps in phase identification, crystallinity control, and detection of phase transitions already at the active material synthesis stage.
Recycling and black mass — a new frontier 2025–2026
Lithium cell recycling is one of the fastest-growing implementation fields for spectroscopy. Multi-wavelength resonance Raman spectroscopy (MWRRS) is used to identify crystalline phases, oxides, and graphite in black mass — the fraction after mechanical cell shredding, whose composition determines the hydrometallurgical pathway. Raman also allows monitoring the hydrometallurgical conversions themselves, providing information on lithium, manganese, or cobalt compounds in process solutions.
The second area is the identification of polymers separators and structural components. In May 2026, a paper was published in Journal of Raman Spectroscopy describing deep-UV Raman as a method for sorting black plastics in recycling — the excitation band in deep UV lies above the fluorescence background of typical pigments, allowing identification of polymer types that standard 785/1064 nm Raman misses due to background signal.
All-solid-state batteries — Raman in sulfide electrolytes
Solid-state batteries (ASSB) with sulfide electrolytes (Li2S–P2S5, LGPS type) are an area where Raman is a first-line tool for characterizing electrolyte structural units. In-situ Raman detects the partially reversible conversion of PS4³⁻ units to P2S6⁴⁻ dimers and the appearance of a transient phase before full reduction to Li3P. This helps understand electrolyte and interface degradation pathways, which today are the main blocker for ASSB commercialization.
The next-generation solid electrolyte roadmap published in 2026 emphasizes that operando Raman, NMR, and XPS methods remain the primary set for tracking mechanisms on the solid electrolyte chemistry side. For manufacturers, this is a signal that bench-top Raman in the materials laboratory is now part of the R&D standard, not an option.
What follows from this for the decision-maker — year 2026
The map of Raman applications in the lithium-ion battery ecosystem in 2026 looks different than 3 years ago. Operando Raman in a single cell is a mature research method — it provides insight into the cathode, electrolyte, and interfaces with chemical accuracy that no other non-destructive technique offers. On the production line, process Raman is realistically entering electrode coating control, active material quality (LFP, NMC), and raw material identification. Recycling and black mass is a new, dynamically growing front where Raman serves for fraction classification and hydrometallurgical chemistry monitoring.
Less mature remain: measurements of inline silicon anode stress (still reserved for research microscopy), full cell state-of-health (SOH) assessment by Raman without NMR/XPS reference, and all-solid-state monitoring at pre-production scale, where the sulfide cell package significantly complicates optical acquisition under industrial conditions.
Spectrally X1 — adaptation capabilities for battery analytics
The Spectrally X1 Family is a platform for process Raman spectroscopy. We have the most deployments in process chemistry — phenol-formaldehyde and urea resins, cosmetics and detergents (SLES, glycerin), fertilizers (urea, biuret, RSM, AdBlue), adhesives, hydrocarbons, and wastewater monitoring. We are entering battery analytics on a project basis: the probe configuration, chemometric model, and DCS integration are tailored to the specific application during feasibility studies using client samples. We apply the same approach — feasibility-first before CAPEX — in every industry that is new to us.
- Spectrally X1 LAB — benchtop analyzer with a carousel for up to 25 samples and through-package analysis through transparent glass packaging; useful in active material R&D laboratories (LFP, NMC), validation of chemometric models, and batch control of precursors before introduction to the line.
- Spectrally X1 PORTABLE — portable analyzer for raw material identification at the warehouse gate (incoming QC of carbonates, lithium salts, separator polymers) and model verification in the field and on the production floor.
- Spectrally X1 INLINE — process analyzer with an immersion probe for liquid streams; for potential adaptation in hydrometallurgical black mass recycling (control of Li/Mn/Co/Ni solutions) or cathode precursor synthesis processes — configuration after feasibility on samples. Communication: PROFIBUS, PROFINET, GSM, up to 100 m fiber optic.
- Spectrally OS — software layer with PLS and CNN models, a library of ~28,000 spectra, and a centralized panel for monitoring model drift during line operation.
Measurement in battery conditions always requires adaptation — wavelength (typically 785 nm for cathode materials and carbon coatings, 1064 nm considered when background fluorescence is a blocker), probe geometry (back-scatter for electrode surface, immersion for liquid streams), acquisition time typically 5–300 s depending on signal. Configuration is determined after a feasibility session on real customer samples.
Frequently asked questions
Will process Raman replace impedance measurements (EIS) in cell state monitoring?
No — and that is not its role. Raman provides chemical information (composition, phase, molecular stress), EIS provides electrochemical information (impedance, kinetics). The complementarity of these methods is precisely the subject of active 2025–2026 publications, and it is their combination that gives a complete picture of cell state.
Which excitation wavelength is best for NMC and LFP cathodes?
The most commonly used is 785 nm — a compromise between sensitivity and background fluorescence. For samples with a strong background (organic contaminants, strongly fluorescent binder polymers), 1064 nm is sometimes considered. The wavelength choice is adapted to the specific matrix and sample condition.
Can Raman measure electrolyte composition in an unopened cylindrical cell?
In typical metal casings (18650, 21700) — no, the metal blocks the optics. Operando measurements require special measurement cells with an optical window or fiber optic probes introduced into the interior. This is a laboratory method; in production, Raman enters before cell closure (electrode coatings, electrolyte before filling) or after — in recycling, on the black mass fraction.
Does Gekko Photonics have implementations in the battery sector?
Our largest number of implementations is in process chemistry — resins, cosmetics, fertilizers, adhesives, hydrocarbons, wastewater monitoring. In battery applications (active material R&D, black mass recycling, raw material control) we work on a project basis: we verify during a feasibility cycle on client samples whether Raman is the appropriate method for the given analyte and matrix, before the client commits CAPEX. Spectrally X1 is a process platform that we configure for the specific application — probe, model, DCS integration.
How does process Raman differ from FTIR and NIR in battery analytics?
Raman works well in aqueous solutions (FTIR has a problem with water absorption here), excellently identifies crystalline phases (NIR is weaker), but handles strongly fluorescent matrices less effectively. NIR remains competitive in quantitative monitoring of organic solutions; a comparison of Raman vs NIR vs FT-IR is discussed in more detail in a separate post.
Test measurement and engineering consultation
If you are developing processes in the area of cell production, black mass recycling, or active material R&D — at Gekko Photonics we select the Raman analyzer configuration on a project basis, starting with a feasibility session on real samples from your process. Our largest number of implementations to date is in process chemistry (resins, cosmetics, fertilizers), and we designed Spectrally X1 as a process platform that we configure for the specific application — probe, model, DCS integration. We perform a test measurement (typically within 10 business days of sample delivery) and present a feasibility assessment report along with an architecture proposal (lab vs portable vs inline) and a preliminary chemometric model.
The average implementation time for a complete system — from workshop to operational line — is 3–5.5 months, with a typical ROI in the range of 6–10 months. Write to us with a brief process description, and we will return with an agenda for a 30-minute conversation with an application engineer. On the process analyzer side, we also have an overview of the entire device family and the context of multi-probe architectures in processes with distributed measurement points.