
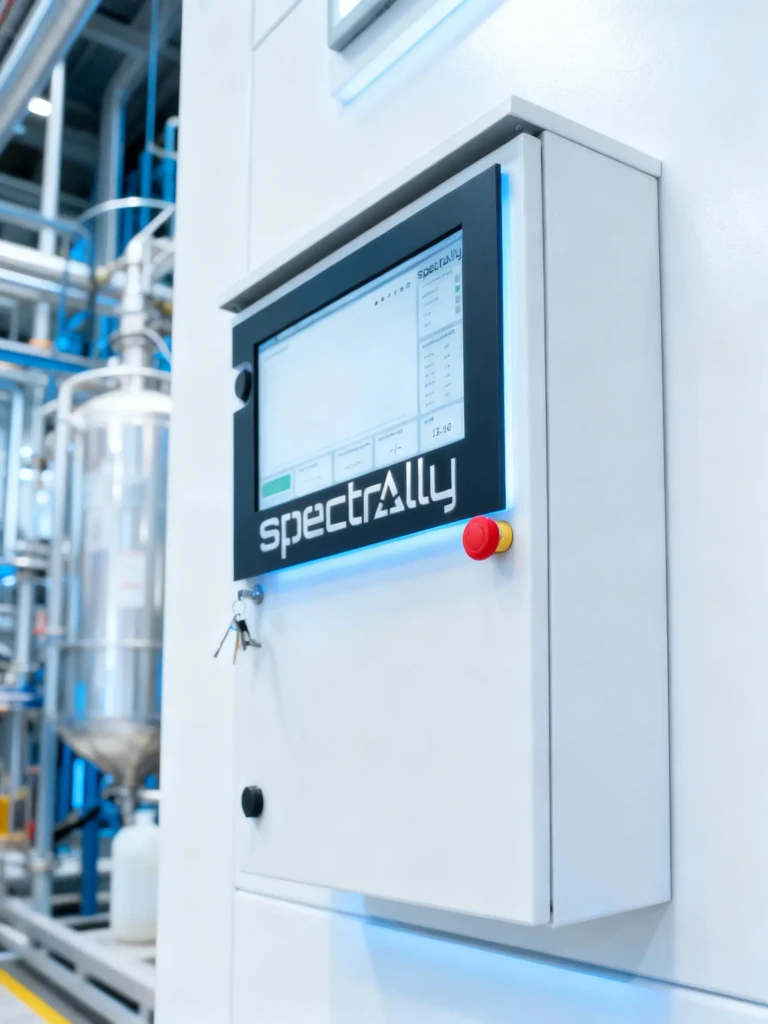
Spectrally™ X1 INLINE
Real-time quality control, directly in the process

Measurement without sampling and without downtime
Designed for 24/7 operation, even in demanding conditions
Integration of results with control systems / QA reports
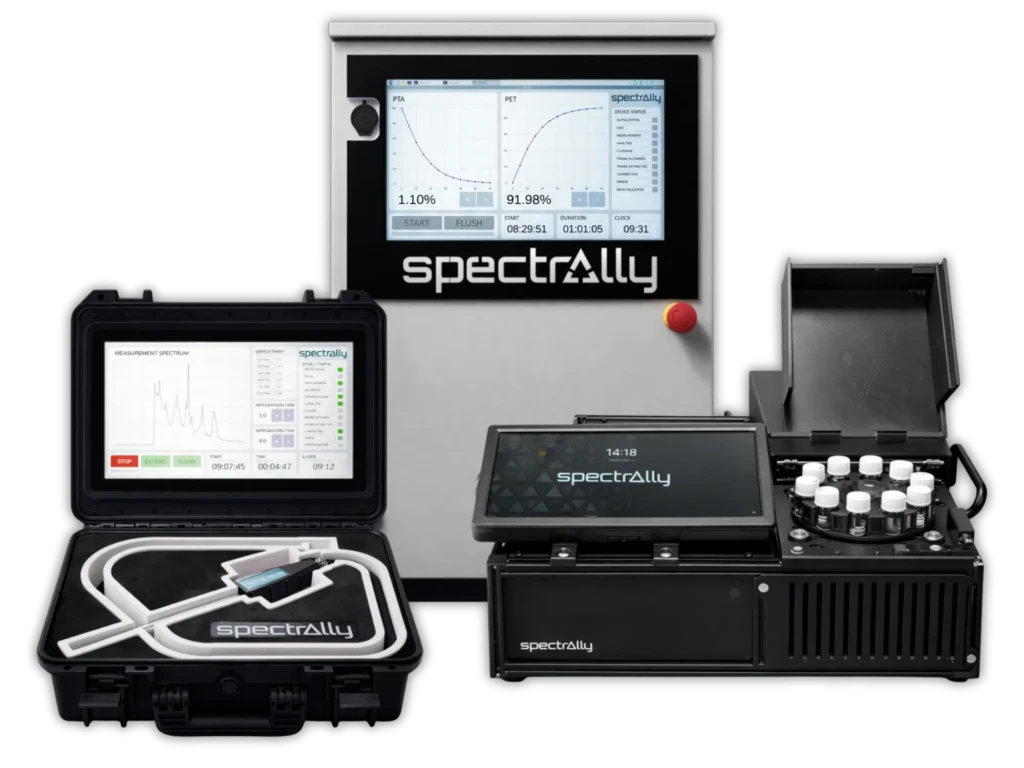
Real-time quality control, directly in the process
Measurement without sampling and without downtime
Designed for 24/7 operation, even in demanding conditions
Integration of results with control systems / QA reports
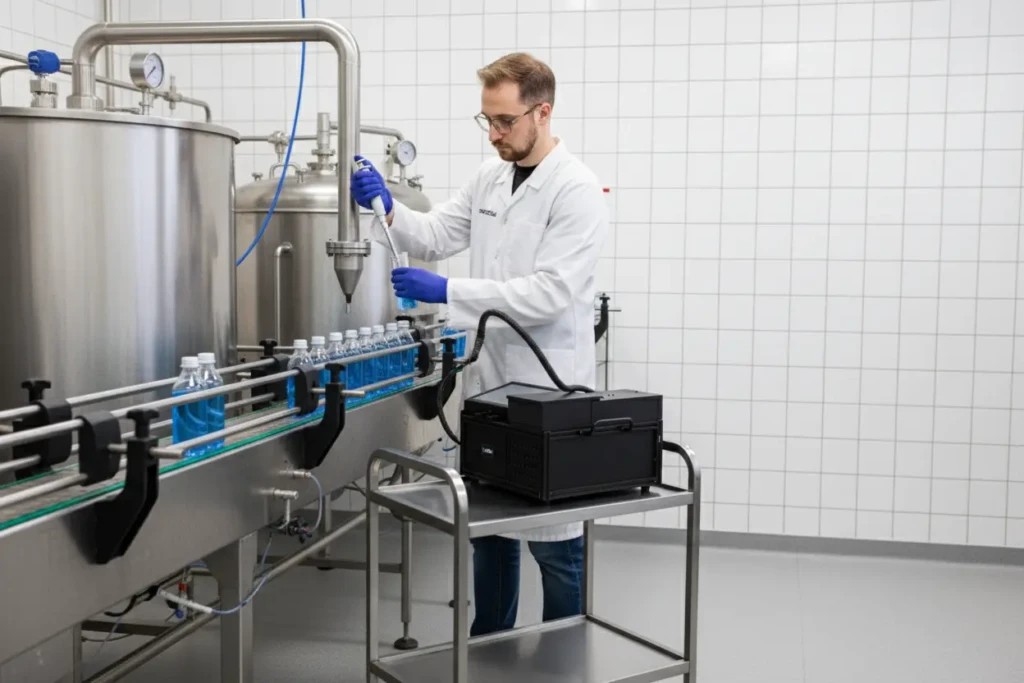
The bridge between the laboratory and production
Rapid verification of batch composition without tedious sample preparation
Support for scaling formulations from R&D to production
Real-time data visualization and analysis
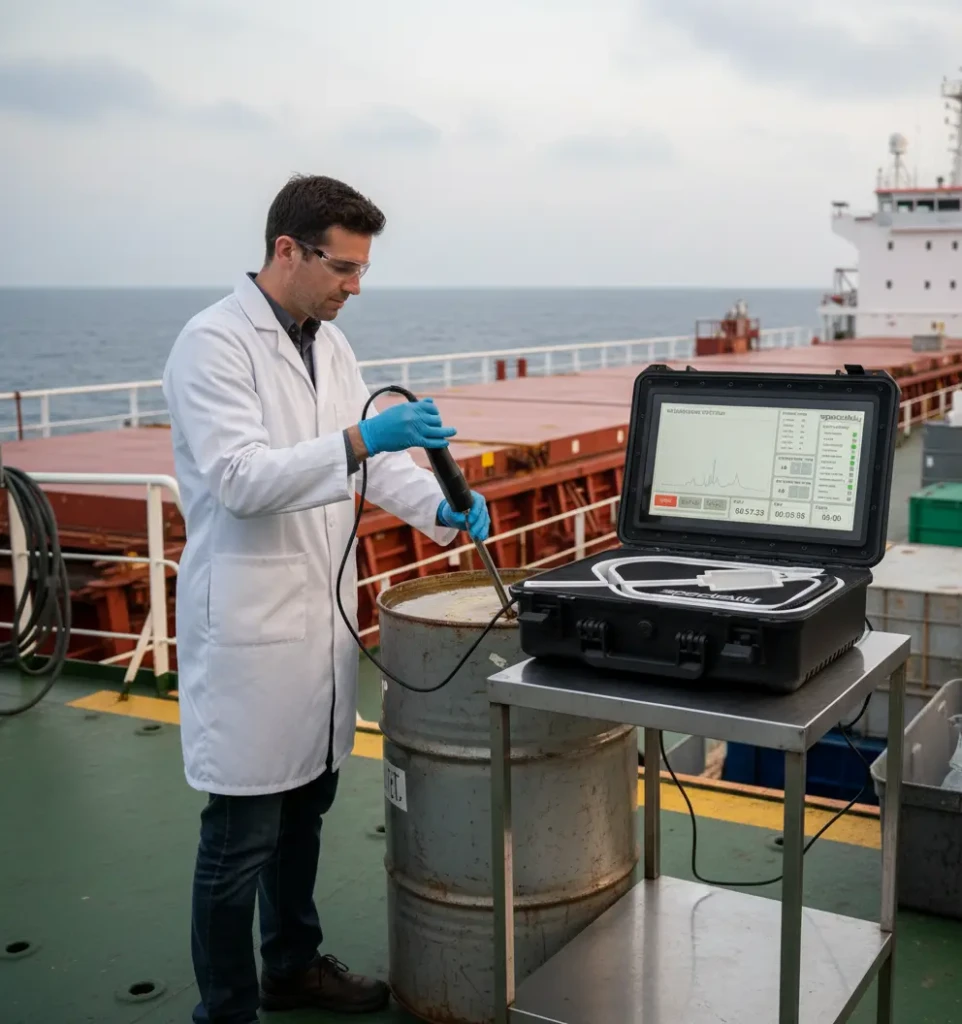
Mobile raw material identification and incoming quality control (IQC)
Fast PASS/FAIL, even without opening the packaging (for transparent packaging)
A tool for raw material control at warehouse intake and in the field
Non-destructive measurement with results in seconds
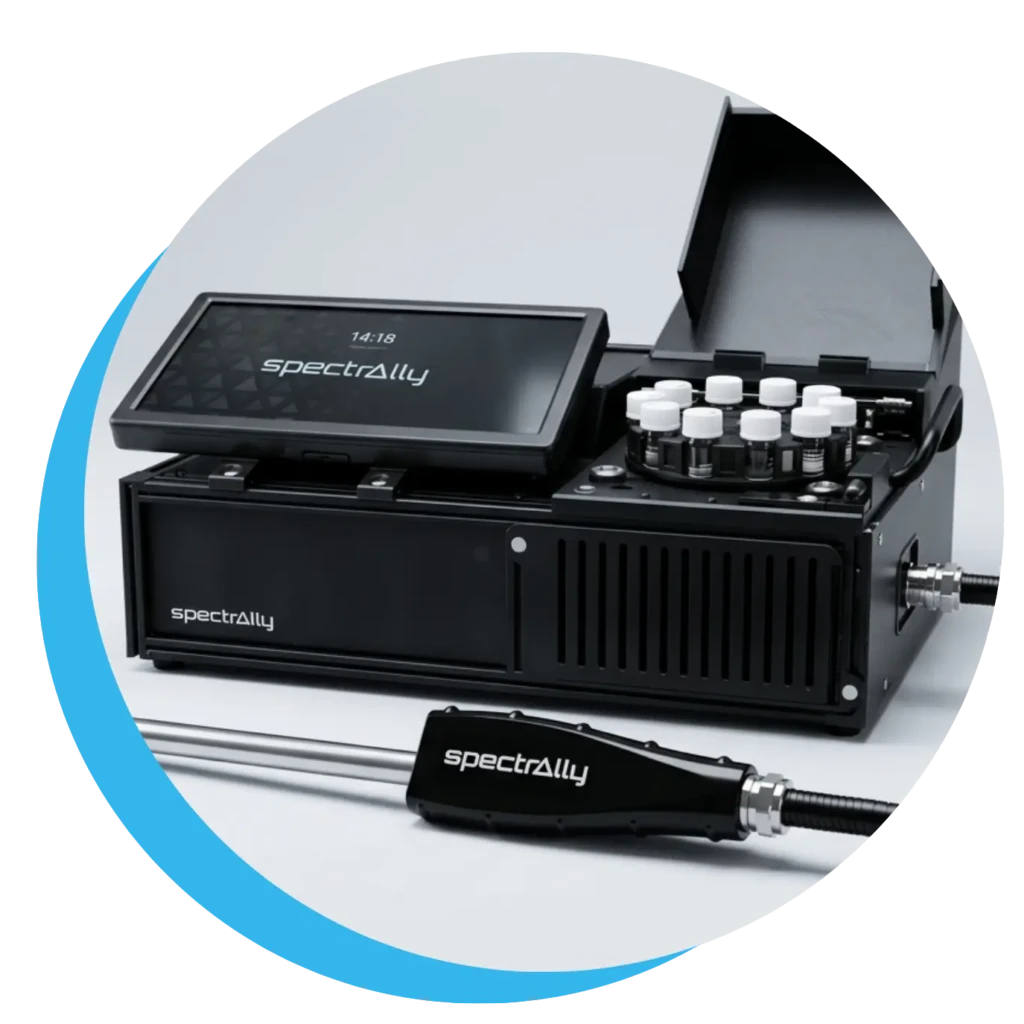
Dedicated software with proprietary analytical models
Analyte signal converted into a user-readable result
Rapid development and deployment of models in response to specific process issues
Real data for automating and optimizing the production process
The Spectrally™ analyzer utilizing Raman spectroscopy enables analysis of solids, pastes, powders, and liquids, including aqueous applications – with results converted into process indicators and alerts.
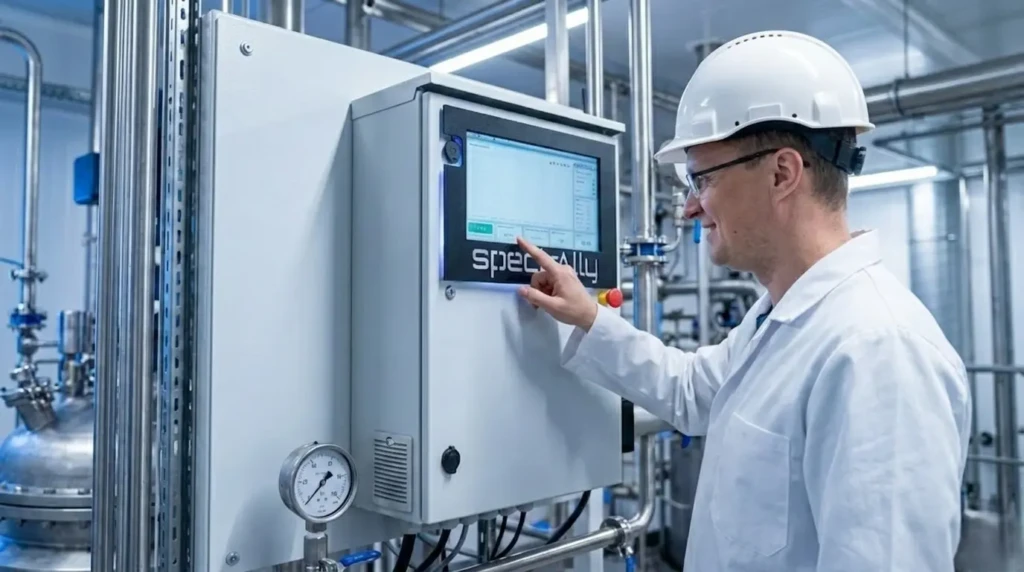
Reduction of errors and decision delays
Elimination of operational decision delays thanks to instantaneous measurements
Time savings, reduction of operational costs (personnel, sample transport, waste)
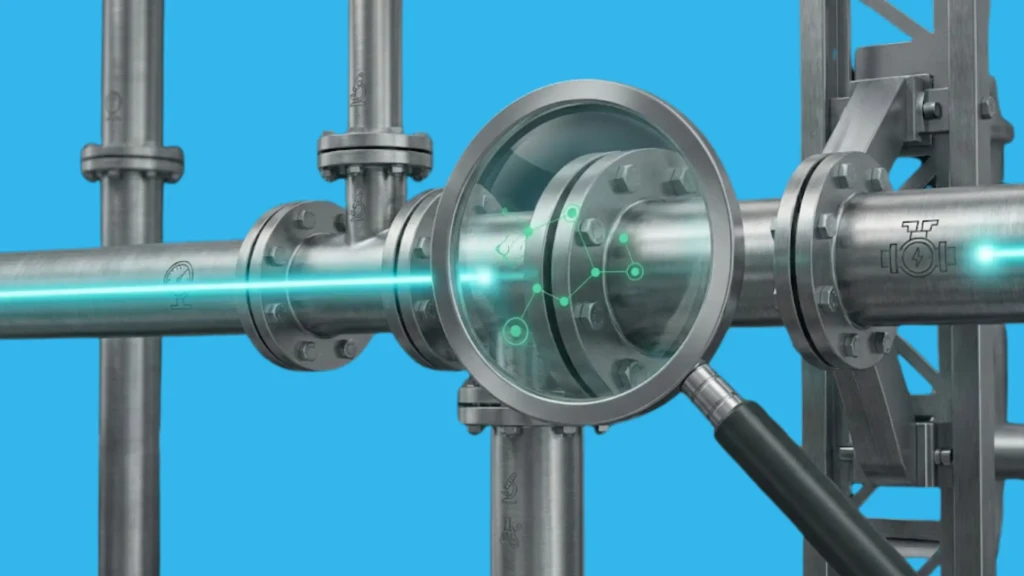
We jointly analyze where the greatest losses, quality deviations, and downtime risks occur in the process. Based on this, we select measurement points in specific processes that will yield the fastest return on investment.
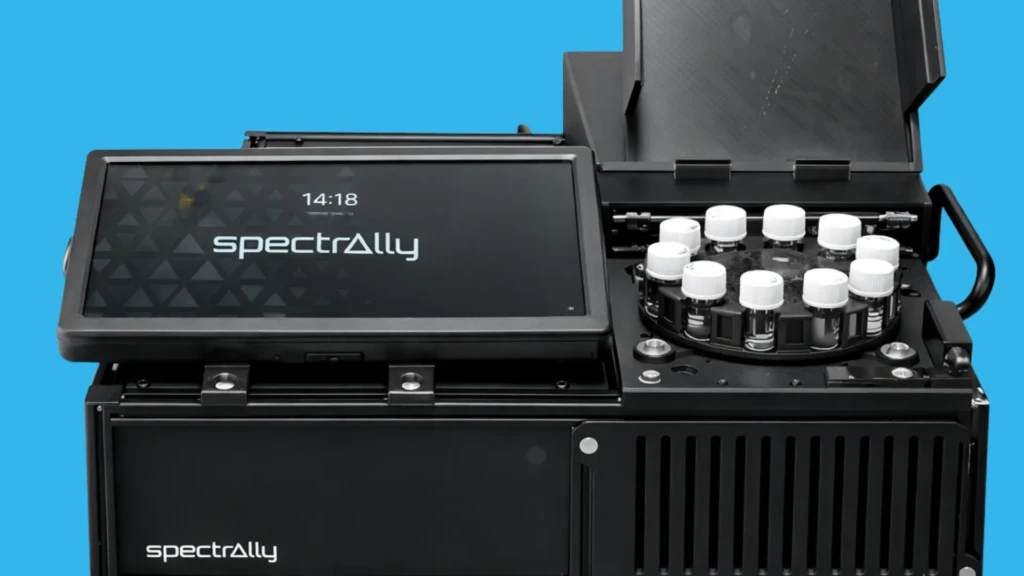
We test samples from your process to confirm whether the measurement technology and algorithms meet the requirements. You will receive a clear report on the implementation potential.
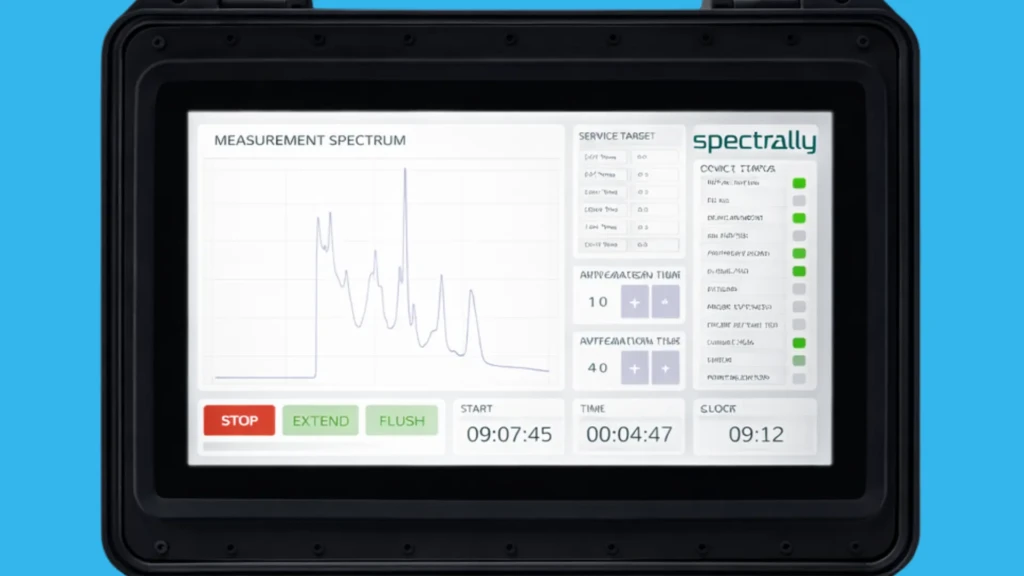
We design the measurement configuration (in-line / at-line / mobile), measurement points, integrations, and results reporting method. We present an implementation plan and a return calculation based on process data.
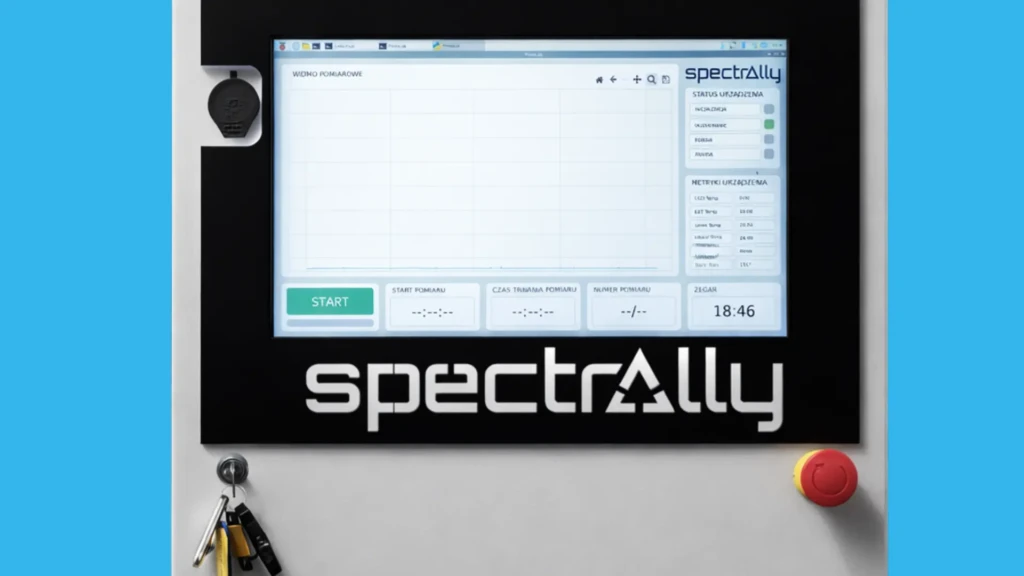
We install the system, launch models, and train your team so that the results immediately support production and quality decisions. We provide service support, updates, and model development as the process evolves.






Challenge (before implementation):
Solution
Continuous monitoring with the Spectrally™ system: 24/7 hydrocarbon detection (also under variable atmospheric conditions).
Results
Challenge (before implementation):
Solution
The Spectrally™ measurement system is resistant to harsh operating conditions involving resins, performing automatic measurements during each production batch.
Results
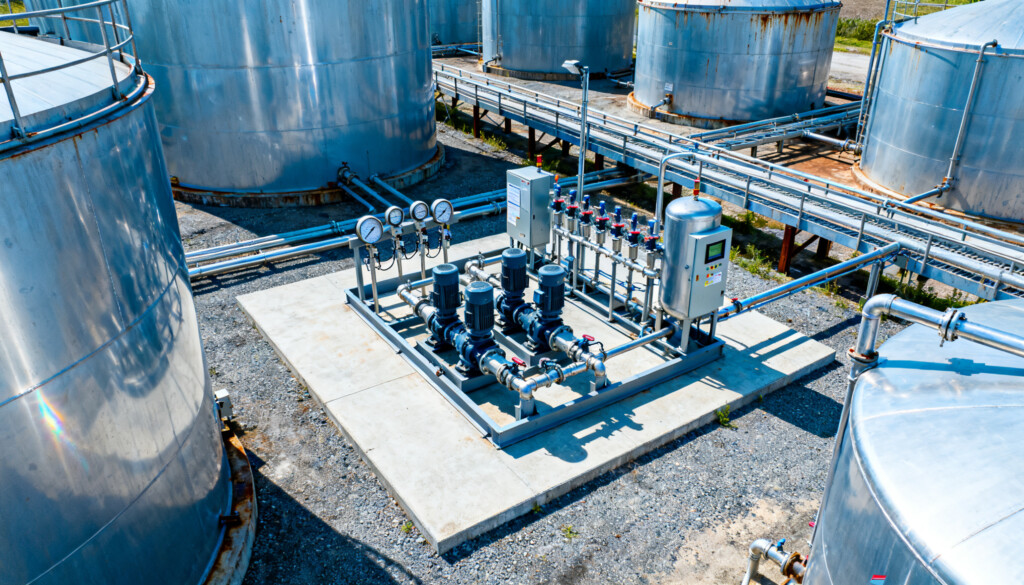
The plant produces UAN 28, 30, or 32 to customer order on a single continuous mixing line. Hitting the specification window for the selected grade and reaching it quickly during grade changes determine the amount of transitional material and the nitrogen above declaration. We demonstrate how to control composition directly in the mixing line.

In acrylic dispersions and resins, the copolymer composition and its homogeneity determine the glass transition temperature (Tg) and coating properties, while residual monomer is subject to customer regulations. We demonstrate how to monitor monomer conversion and copolymer composition directly in the reactor.

The molar F/U ratio in UF resin is a fundamental parameter determining formaldehyde emissions from the finished board, and it directly results from the composition of the received UFC concentrate. We demonstrate how to verify the F/U ratio and formaldehyde content in UFC upon delivery – within 1–2 minutes and without reagents.
Gekko Photonics is formed by individuals with experience in photonics, spectroscopy, and deep-tech implementations. We combine R&D work with responsibility for the result on-site — from the first measurement to stable operation in production.

Yes. Process systems are designed for continuous operation and can function in demanding conditions (e.g., temperature/pressure), with results available in real time.
The result is available within seconds, usually without sample preparation. This shortens the decision-making path and reduces the number of manual steps on the laboratory side.
It depends on the application, but it is sometimes possible to start with even a small number of samples. In a feasibility study, we confirm whether we can achieve the required accuracy and under what conditions.
Yes. Results can be integrated into QA reporting and used for alarms/trends as well as integration with control systems (depending on the implementation architecture).
We start by identifying critical points, then conduct a feasibility study on samples, followed by designing the architecture and implementing the solution along with service.
Yes — also in aqueous environments. For example, hydrocarbon monitoring can operate 24/7 with measurement frequencies on the order of minutes, allowing for faster response to incidents.
The most common limitations depend on the sample (e.g., fluorescence) and require proper selection of configuration and chemometrics. Therefore, we verify this in a feasibility study using your materials.
Yes — during the testing phase. In reference projects, very low errors relative to laboratory methods (e.g., HPLC) are possible, and we establish target KPIs based on your requirements.

We use cookies to ensure the site functions properly, measure traffic, and personalize marketing only with your consent.