
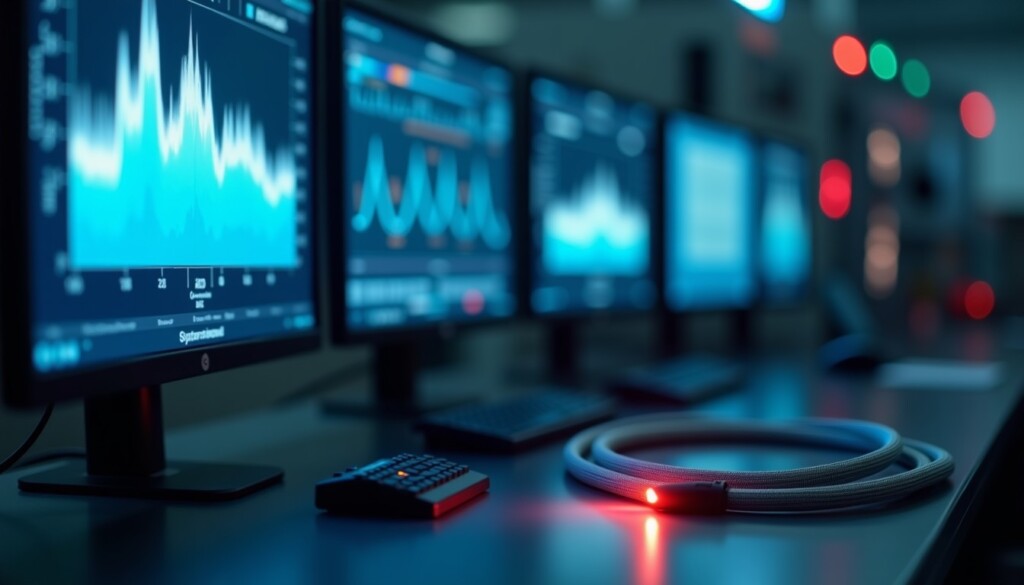
Industry 4.0 has ceased to be a slogan — in the production halls we enter with our analyzers, it is already a set of concrete architectural decisions: where DCS ends and MES begins, how batch context flows, who holds the chemometric model, and who is responsible for its drift. We view photonics not as a sensor in itself, but as a measurement layer of the digital plant: a source of spectral data that must be integrated with control systems, archived, modeled, and translated into control actions. This article shows where this layer is heading in 2026 and what decisions arise from this for engineering teams designing new lines or modernizing existing ones.
This text is aimed at process engineers, OT/IT automation specialists, maintenance managers, and R&D managers in process chemistry. We focus on three fronts: integration of the spectral layer with the control layer, AI models in chemometrics, and the new generation of digital twins enriched with PAT (Process Analytical Technology) data. We do not discuss consumer photonics or data center transceivers — although technically the same market segment, they hold no operational relevance for the process industry.
What Industry 4.0 really changes in process analytics
In a classical analytical architecture, data from the QC laboratory returned to the line with a delay of hours or days. The operator did not know whether a specific batch met specifications until receiving a result from the chromatograph. This is not merely inconvenient — it means rework, buffer overproduction, margins eroded by variability, and control decisions based on measurements that are already outdated by the time they reach the DCS.
Industry 4.0 — as our clients actually implement it — boils down to several specific changes:
- Measurement moved into the process. A spectrometer in a process enclosure, an immersion probe in the reactor, a fiber optic cable to the analyzer cabinet. Chemical results in seconds, not hours.
- Batch context at every measurement point. The Raman spectrum archived together with the batch number, recipe, reactor phase, jacket temperature, and operator signature. Without this context, spectral data are just numbers.
- Chemometric models as a system element. PLS, PCA, and increasingly convolutional neural networks (CNN) that transform spectra into specific process values — concentrations, conversion rates, end-points. Models live in the software layer, are versioned, and monitored for drift.
- Bidirectional data flow. The spectrometer not only publishes results to the DCS — it receives process metadata from the DCS (recipe, phase), which enters the spectral database as calibration context.
- Audit and compliance. Every measurement is logged with metadata, every model change requires authentication (RBAC), every report export carries a digital signature. This is a requirement for an increasing number of industries — from pharmaceuticals through specialty chemicals to cosmetics.
SPECTARIS — the German photonics industry association — in its 2025/2026 trend report emphasizes that the integration of photonics with the plant's digital infrastructure is today the main growth vector, more important than individual instrument parameters. From our operational perspective, this is confirmed: client discussions increasingly focus less on spectral resolution and more on how the analyzer fits into the existing OT/IT stack.
Photonics as the measurement layer of Industry 4.0
Photonics gives the process industry something that classical temperature, pressure, or flow sensors cannot: a direct chemical reading from the process, without sampling, without reagents, in seconds.
Three techniques dominate process analytics:
- Raman Spectroscopy — chemically selective, works in water, through glass and quartz packaging, good differentiation polymers and polymorphs. Weakness: fluorescence of some matrices (solved with 1064 nm laser or algorithmically).
- NIR (Near-Infrared) — fast, good for moisture, oil, protein content. Weakness: lower specificity, models sensitive to sample conditions.
- FT-IR — high resolution, laboratory classic. More difficult in process version due to the need for thin liquid layers or gas cells.
In our projects, we most often choose Raman — because it directly measures the chemical structure of bonds, works in aqueous solutions (typical for process chemistry, cosmetics, fertilizers, wastewater), and can be placed in an immersion probe directly in the reactor or pipeline. Our Spectrally X1 INLINE operates with a 785 nm laser and 600 mW power (30 mW in ATEX version), uses a thermoelectrically cooled back-thinned CCD detector, and communicates with the DCS via PROFIBUS, PROFINET, or GSM. The Retractex self-cleaning probe ensures measurement continuity in difficult media (resins, viscous liquids, deposits), where product buildup on the optical window would be an operational problem. Details of wavelength comparison are described in the article 785 nm vs 1064 nm — how to choose the Raman wavelength.
Three development fronts in 2026
1. AI/CNN models in chemometrics — the end of the PLS-only era
Classical chemometrics stood on three pillars: PCA for dimensionality reduction, PLS for spectrum→concentration regression, and SIMCA-type classifications. These methods have not disappeared — they are still very good for problems where the calibrant covers the entire operational range and spectra are stable. But two situations required something more:
- Complex matrices, where local nonlinearities and multiple overlapping bands cause PLS to struggle with residual variance.
- Anomaly detection — a PLS model does not know that it has just seen something not present in the calibrant. CNNs trained with uncertainty awareness mechanisms can flag this.
In practice, the direction is that PLS remains as a fast, deterministic first-line estimator, while CNN/auto-encoders are added as a layer above it — catching cases where the base model is uncertain about the result. In Spectrally OS we support all these models (PLS, PCA, CNN) in a single platform, with a library of approximately 28,000 reference spectra as a starting base for new projects. The entire stack runs on Debian GNU/Linux 13.2, with RBAC at the operator and chemometrician levels and a full audit trail for every model change.
2. Digital twin + PAT — virtual analytics
The most promising trend, especially for regulated industries: a plant digital twin enriched with PAT data. A classical digital twin is a physicochemical model of the line — mass balances, reaction kinetics, heat exchange. Valuable on its own, but when integrated with real spectral measurements, it becomes something new: a closed loop comparing model with reality in real time.
Industry publications already report the first documented implementations of autonomous PAT integrated with a digital twin for biological production — a system where Raman measurement in the bioreactor corrects kinetic model predictions, and the model in turn dynamically adjusts the spectrometer's sampling strategy. Transferring this pattern to process chemistry — resins, fertilizers, polymers — is only a matter of time and the availability of reference data.
For the line operator, this means a so-called soft sensor: a model estimates a quantity that cannot be measured directly (e.g., concentration of an intermediate product with a weak Raman band), using data from direct measurements and the process model. The soft sensor does not replace hardware but allows more information to be extracted from the same analyzer.
3. Communication standards — PROFIBUS, PROFINET, OPC UA, MQTT
The most mundane but operationally most important front: how the analyzer communicates with the rest of the system. There is no single winner here, only a stack:
- Field layer: PROFIBUS DP / PROFINET for connection to DCS and PLC, the classic for process chemistry in Europe.
- Control → MES layer: here, increasingly OPC UA as a neutral bridge between DCS units from different manufacturers and the MES/historian layer.
- IoT/cloud layer: MQTT or Sparkplug B for remote monitoring, service telematics, access for engineering teams outside the plant.
The choice of a specific standard is not an analyst's decision — it is a decision for the entire IT/OT team and must be agreed upon before selecting the analyzer. Experience shows that this is where projects most often lose time: when it turns out that the analyzer's adopted communication stack does not match the MES gateway or requires an additional driver. In our deliveries, we standardly support PROFIBUS, PROFINET, and GSM on the X1 INLINE side — a full overview of the integration architecture is described in the article Integration of the analyzer with DCS, MES, and SCADA.
What this means for your line
Three specific questions worth asking before implementing a photonic analyzer in an Industry 4.0 architecture:
- Does our data model include spectra? If the historian archives only scalars (one process variable, one timestamp), a separate spectral database must be planned — typically directly in the analyzer (local database) plus export to a data lake.
- Who is responsible for the chemometric model? This is a new role, hybrid between process engineer and data scientist. Whether in-house, outsourced to the supplier, or shared with a central laboratory — this is an organizational decision with major operational consequences.
- How will we monitor model drift? Chemometric models age — the composition of raw materials changes, batch profiles shift, and minor process modifications occur. Without a monitoring process (e.g., residual statistics, prediction quality degradation alarms), a model may produce incorrect values after a year, to which the operator will rightly cease to respond.
Gekko Photonics solutions for digital process analytics
We have the most implementations in process chemistry: phenol-formaldehyde and urea resins, cosmetics and detergents, fertilizers (urea, biuret, RSM, AdBlue), adhesives, hydrocarbons, and industrial wastewater. In these industries, we deliver a consistent stack: Spectrally X1 INLINE as a process analyzer with an immersion probe, Spectrally X1 LAB for laboratory control with a sample carousel and through-package analysis, Spectrally X1 PORTABLE for mobile raw material verification in the field, and Spectrally OS as a common software layer with CNN/PLS/PCA models, a library of ~28,000 spectra, and full RBAC.
The entire stack shares the same analytics layer — this means a model trained on samples from the X1 LAB can be transferred to the X1 INLINE in production without repeating calibration from scratch. For industries requiring project-based adaptation (pharmaceuticals/biopharmaceuticals, batteries, hydrogen, semiconductors, F&B, polymer recycling, metallurgy), we proceed on a project basis, after feasibility testing on client samples — we first verify whether Raman is the appropriate method for the given analyte and matrix before the client commits CAPEX.
Full catalog of Gekko Photonics process analyzers includes configuration details and probe options for each product line.
FAQ — frequently asked questions
How does Industry 4.0 differ from classic SCADA automation?
Classic SCADA collects process data (temperature, pressure, flow) and visualizes the line status. Industry 4.0 adds a layer of models and context: real-time chemical measurements, batch metadata archiving, chemometric and AI models over raw data, and information exchange between DCS, MES, ERP, and the analytics layer. SCADA without this layer tells you what is happening. Industry 4.0 also tells you why it is happening and what to do next.
Is it necessary to purchase a new DCS for Industry 4.0 projects?
Not always. Most modernization projects add a new analytics and integration layer on top of an existing DCS, using OPC UA as a bridge. Replacing the DCS is a greenfield project or a planned architecture revision — process analytics can be implemented in stages alongside the modernization.
Does Gekko Photonics have implementations in pharmaceuticals or lithium batteries?
We have the most implementations in process chemistry — resins, cosmetics, fertilizers, adhesives, hydrocarbons. In pharmaceuticals, biotech, and batteries, we proceed on a project basis: we verify in a feasibility cycle on client samples whether Raman is the appropriate method for the given analyte and matrix before the client commits an investment budget. We also have two documented feasibility studies in polymer recycling.
What communication standards do you support?
In the Spectrally X1 INLINE, standard protocols are PROFIBUS, PROFINET, and GSM. Integration with OPC UA and MQTT is implemented on a project basis, most often via a gateway on the client's infrastructure side — the analyzer itself publishes via its native protocol, and the gateway exposes OPC UA or Sparkplug B toward the MES layer.
Do chemometric models require support from the manufacturer throughout the entire system lifecycle?
Models can be maintained independently if the plant has a chemometric team — Spectrally OS we provide full tools (training, validation, CSV/PDF/RAW export, audit trail). In our projects, we most often offer a hybrid mode: the first year of calibration support from us, then handover of the model and procedures to the client's team, with optional calibration audits every 12 months.
Let's discuss your process topology
At Gekko Photonics, we tailor the analyzer configuration to the specific plant architecture — DCS, MES, OT/IT stack, chemometric layer, and audit requirements. The first step is a 30-minute conversation with an application engineer, during which we discuss the process, analyte, and integration requirements. The second step is a test measurement on your samples in our laboratory, typically completed within 10 business days of sample receipt. The third step is a feasibility study with a full chemometric report and configuration proposal, completed in approximately two weeks.
If you are planning a line modernization for Industry 4.0 or a new project with spectral analytics in the stack — contact us. We perform a test measurement without obligation, regardless of what stage of planning you are at.