From molecular vibration to a value you can act on.
How a self-cleaning Raman probe in the reactor becomes concentrations, ratios and deviation flags in your control room - in seconds.
A molecular fingerprint, read with laser light.
Shine monochromatic laser light into the reaction mixture. Most of it scatters back unchanged. A small fraction exchanges energy with molecular vibrations and returns shifted - and those shifts are characteristic of the bonds that caused them. The result is a spectrum that works like a fingerprint of everything in the mixture.
Inelastic scattering carries the information
The laser (785 or 1064 nm) illuminates the medium through the immersion probe. Photons that scatter inelastically shift in wavelength by amounts set by the molecular vibrations they met. Plotting intensity against Raman shift (cm⁻¹) gives the raw spectrum.
A fingerprint, not a proxy
Raman bands are narrow and characteristic of specific substances, so several components can be read from one spectrum. That is the difference from single-parameter sensors, which fail in multi-component condensation mixtures.
Water stays out of the way
Water is a weak Raman scatterer. In aqueous condensation media - PF, UF, MUF/MF cooks, formalin streams - the water background does not drown the analyte signal. In FT-IR the opposite holds: water absorbs strongly and destroys the measurement. NIR reads through water better, but its bands overlap and specificity suffers.
HPLC and titration remain the analytical reference. Inline Raman replaces them where decision time and measurement continuity matter - the offline methods become verification, not the bottleneck.
From the reactor wall to the control room.
Four links in the chain: an immersion probe in the process, fiber optics to the analyzer, chemometric models in Spectrally OS, and your control system at the end. There is no sampling loop anywhere in it.
Immersion probe in the reactor or line. IP67, fitted with the self-cleaning module for fouling media. ATEX / IECEx Zone 0 is planned for June 2027.
Excitation light travels to the probe and scattered light returns over fiber, so the analyzer can sit away from the process area while the probe stays in the medium.
785 / 1064 nm laser excitation, back-thinned TEC-cooled CCD detector. Up to 2 measurement channels as standard, more on request.
CNN, PLS and PCA models translate the spectrum into concentrations, ratios and PASS-FAIL flags, then hand them to your PLC / DCS.
The hardware in the chain
The numbers that define the measurement path, probe to analyzer. Calibration is automatic, against a reference integrated in the probe - there is no manual recalibration routine to schedule.
| Measurement principle | Raman spectroscopy |
| Laser wavelength | 785 nm / 1064 nm |
| Detector | Back-thinned CCD, TEC-cooled |
| Acquisition time | 5-300 s |
| Fiber optic reach | Up to 100 m |
| Measurement channels | Up to 2 (expandable on request) |
| Probe | Spectrally X1 PROBE, IP67, self-cleaning (ATEX / IECEx Zone 0 planned for June 2027) |
| Calibration | Automatic - reference integrated in probe |
| Communication | Modbus |
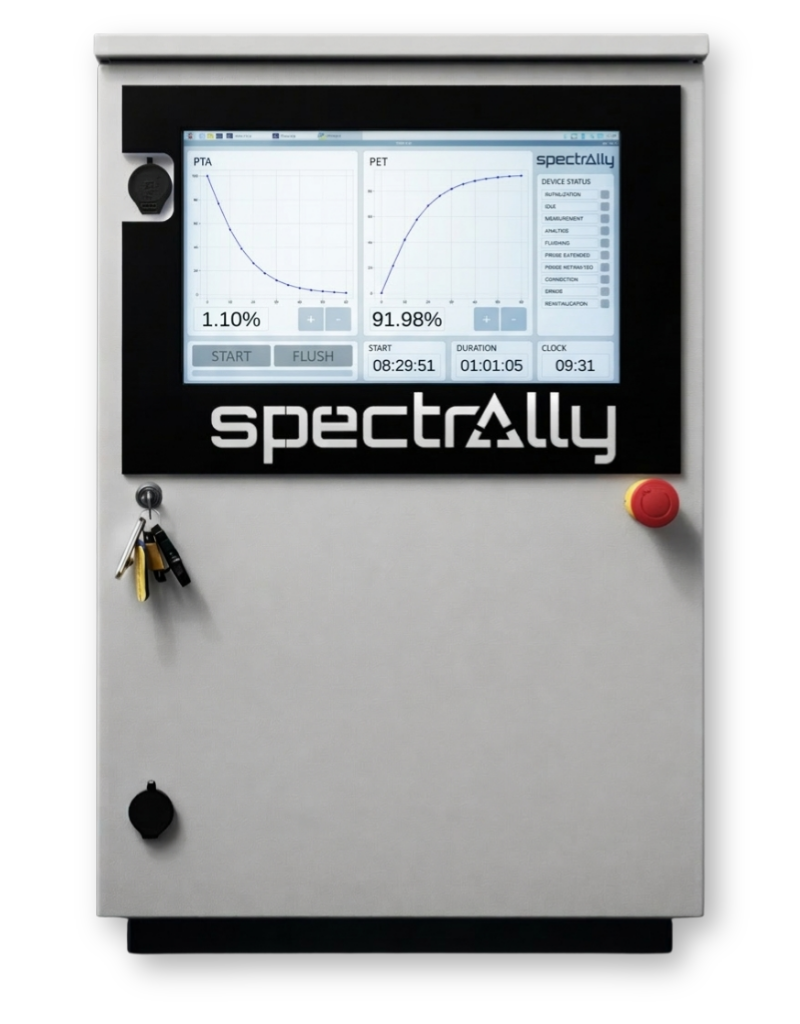
Raman is the core, not the whole toolbox
The core technique - molecular vibrations characteristic of specific substances, read inline in aqueous media.
Surface-enhanced Raman on metallic nanostructures, typically Ag or Au - used when analyte concentrations sit at ppb-ppm levels, below classical Raman sensitivity.
Near-infrared as a complement where Raman bands are weak - for example some O-H bonds.
Complementary sensing for specific challenges. The technique is chosen for the chemistry, not the other way around.
Resins foul optical windows. The probe is built for that.
Phenolic and amino condensation deposits settle on any optical surface left in the process. In strongly fouling media the Raman signal would degrade within hours to days of operation. The self-cleaning module removes that failure mode with a mechanical cycle: retract, rinse, return.
Why windows foul
Deposits and reaction layers build on the probe optics as the condensation runs. A fouled window means drifting spectra first, useless spectra later - in strongly fouling media within hours to days.
The cycle preserves measurement geometry
The probe retracts from the medium, the optical window is rinsed, and the probe returns to the same measurement position. Geometry stays fixed, so readings stay comparable across the whole campaign.
Where it earns its keep
Strongly fouling reactors - phenolic, urea-formaldehyde, alkyd and acrylic resins. Processes with solids or suspensions. Long production campaigns with no service window in sight.
A capability, not an accessory
Without self-cleaning, a process probe in resin service needs manual cleaning - and manual cleaning means breaking a continuous measurement. The module is integrated with Spectrally X1 PROBE and Spectrally X1 INLINE, and it is what makes continuous 24/7 measurement realistic in phenolic and amino chemistry.
The cycle runs automatically during production, so there is no manual optics service in the middle of a campaign and no gap in the data your control system sees.
Spectrum to a process value, continuously.
Up to 45 minutes of HPLC / titration wait, gone.
Mean absolute error vs the reference method.
Acid value and viscosity regressions on real resin.
Spectrally OS turns spectra into operating information.
Raw spectra are useless to an operator. Spectrally OS translates them into concentrations, ratios, PASS-FAIL classifications and alarms - and keeps a logged, auditable history of the models doing the translating.
CNN - pattern detection and classification
Convolutional networks classify complex spectra: does this raw material batch match the specification, is this the stream the recipe expects.
PLS - multi-parameter regression
Partial least squares maps the spectrum to numbers: concentrations of free phenol, urea and the other analytes your specification runs on - several from one read.
PCA - anomaly detection
Principal component analysis reduces the spectrum to its drivers and flags what does not belong - an unexpected fraction in the reactor surfaces as a deviation, not as a customer complaint.
Models start from feasibility - typically your R&D data plus samples measured in the Gekko lab. Built on your matrix, not a generic library.
Predictions are checked against reference measurements on your matrix before the model is trusted in production.
Models are reinforced with your production data as it accumulates. Updates deploy without stopping the analyzer or the line.
Scheduled when the recipe, raw material or process parameters change. A model change - not a platform redesign.
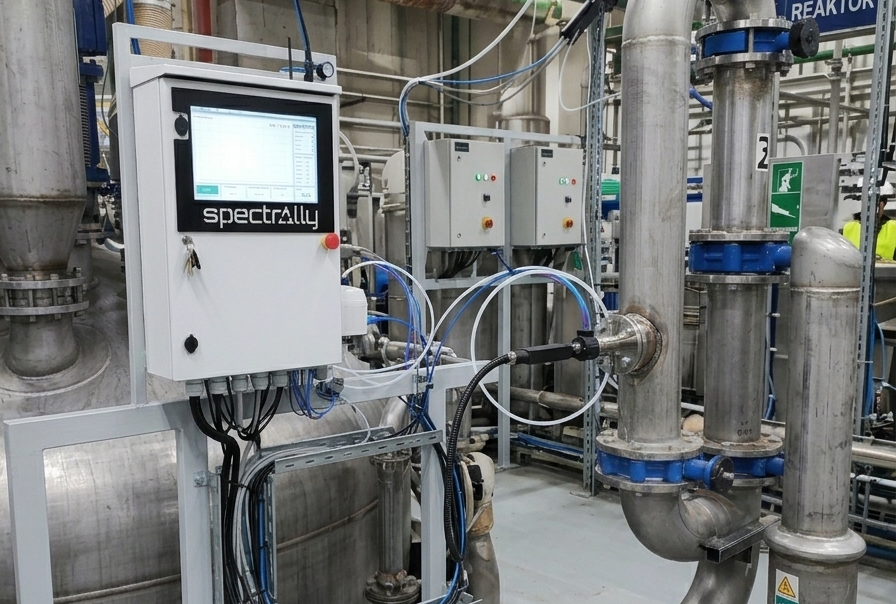
Spectrally OS at a glance
One model layer runs across Spectrally X1 LAB, X1 PORTABLE and X1 INLINE, so a model built during feasibility migrates to the process instrument. Routine operation uses no reagents and no consumables.
| Supported instruments | Spectrally X1 LAB / PORTABLE / INLINE |
| Predictive models | CNN, PLS, PCA |
| Spectra database | Proprietary + public, ~28,000 spectra |
| Operator interface | SpectrallyUI |
| Operating system | Debian GNU/Linux 13.2 |
| Calibration | Automatic, from a built-in reference signal |
| Data export | CSV, PDF, RAW |
| User management | Role-based access control (RBAC) |
| Data storage | Local database - logging continues without a network |
| Model updates | Deployed without stopping the analyzer |
A value counts when it lands in your control system.
Spectrally streams process values - not raw spectra - into the plant's control and data layers. SpectrallyUI shows trends and alerts at the analyzer; the same values reach your PLC / DCS, where a reading can drive a setpoint correction, an alarm, a quality report or a batch hold.
PLC / DCS
Values arrive as process signals over Modbus - unified across all Spectrally products. To the operator, the analyzer reads like any other instrument on the loop.
MES / SCADA / LIMS
Configured per site: batch context in MES, trending and supervision in SCADA, reconciliation with lab records in LIMS.
Modbus and export
Modbus is available across the product line. Data exports in CSV, PDF and RAW for reporting and archive.
Network fit
Segmentation, white-listing, no open ports to the corporate network - typical OT policies are scoped with your automation and IT teams during integration.
Industrial cyber
IEC 62443 expectations for industrial automation systems are addressed in integration scoping, together with backup and recovery of measurement data.
Continuity and audit trail
Measurement and logging run on a local database, so readings continue when the network does not. Model changes are logged and auditable.
Run the full chain on your own samples.
A feasibility study starts with representative samples or R&D data from your process. We build and validate the chemometric model in the Gekko lab and show you exactly what the probe-to-DCS chain would read on your line - before any hardware decision.