We implement chemical analysis where decisions must be made in real time.
In process industries, laboratory control alone often comes „after the fact” — because obtaining a result requires sampling, logistics, and analysis, while the process has already moved forward. That is why we implement process analytics, which provides continuous and immediate data under real production conditions (temperature, pressure, 24/7 operation).
Industries
Tailored for various industry branches
Cosmetics and Detergents
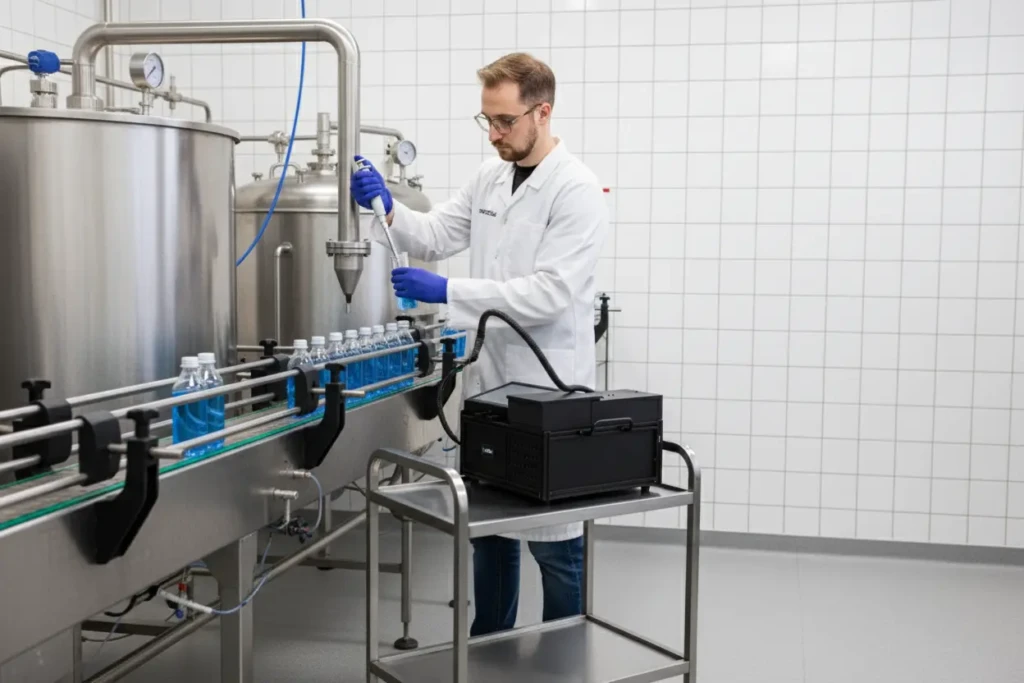
Real-time inline monitoring helps respond faster to adverse changes and fluctuations in the production process, reduce raw material losses, and maintain stable production quality.
Petrochemicals
Petrochemical plants require continuous monitoring of process stream compositions to detect deviations faster and stabilize product quality. Spectrally supports inline monitoring, reduces raw material losses, and enables more efficient operational decisions.
Fertilizers
Fertilizer production requires stable control of key component concentrations and rapid detection of process deviations. Spectrally supports inline monitoring, improves batch repeatability, and relieves the quality control laboratory.
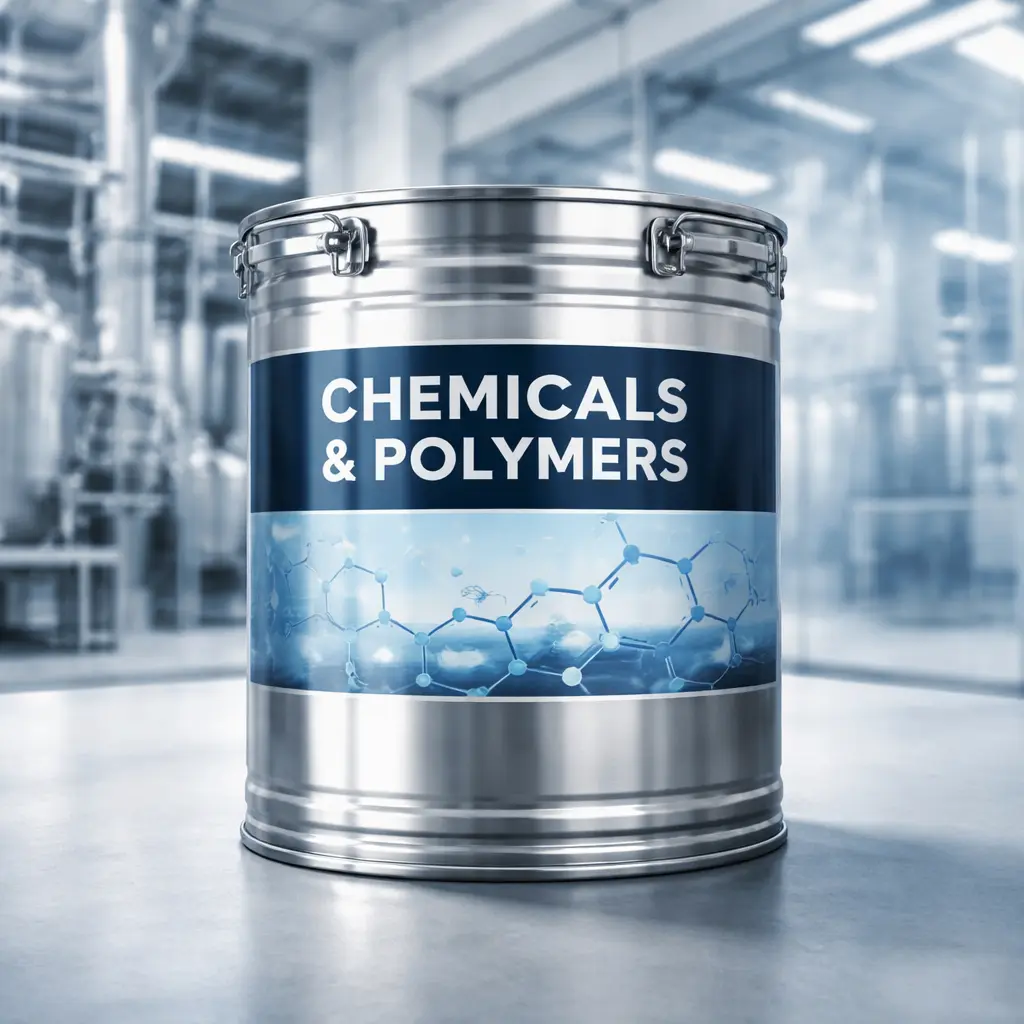
Chemicals and Polymers
Chemical and polymer production requires precise control of composition, reaction progress, and batch quality at every process stage. Spectrally supports inline monitoring, faster deviation detection, and stabilization of production parameters.
Environmental Monitoring
Environmental monitoring requires fast and reliable identification of contaminants in water, soil, and air to respond earlier to deviations and limit environmental risk. Spectrally supports inline and field measurements, helping shorten analysis time, increase inspection frequency, and streamline operational decisions.
Water and Wastewater
Water and wastewater management requires continuous control of medium quality and rapid identification of composition changes to stabilize treatment and purification processes. Spectrally supports inline monitoring, reduces delays associated with laboratory analysis, and helps respond faster to process deviations.
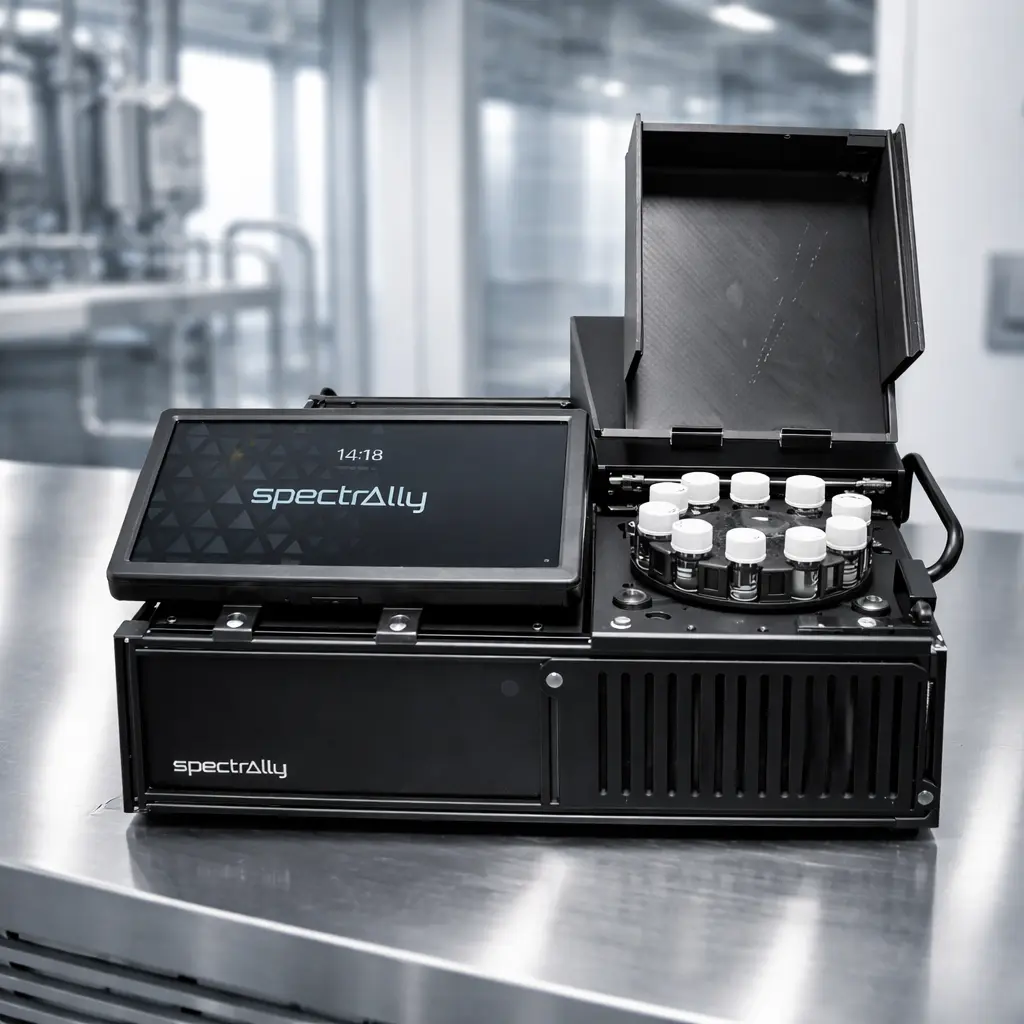
Why these specific industries?
Because time, efficiency, and process control matter.
In practice, plants gain:
- Real-time results – No waiting for the laboratory, so technological and quality decisions are made on the fly.
- Frequent or continuous measurement. – Instead of a single sample, they see the process trend, detect deviations and incidents faster.
- Operationally clear result. – In the form of an indicator, alarm, or PASS/FAIL, ready for use by production and quality.
Our products
In-line, At-line/Lab, and Portable
Spectrally Inline
Real-time quality control, directly in the process
Measurement without sampling and without downtime
Designed for 24/7 operation, even in demanding conditions
Integration of results with control systems / QA reports
Spectrally At-line/Lab
The bridge between the laboratory and production
Rapid verification of batch composition without tedious sample preparation
Support for scaling formulations from R&D to production
Real-time data visualization and analysis
Spectrally Portable
Mobile raw material identification and incoming quality control (IQC)
Fast PASS/FAIL, even without opening the packaging (for transparent packaging)
A tool for raw material control at warehouse intake and in the field
Non-destructive measurement with results in seconds
Spectrally OS
Dedicated software with proprietary analytical models
Analyte signal converted into a user-readable result
Rapid development and deployment of models in response to specific process issues
Real data for automating and optimizing the production process
Selected Case Studies
Case study 1
Water and wastewater: hydrocarbon detection.
Challenge.
Unstable production causing variable reagent concentrations in the final product. Additionally, long waiting times for laboratory results prevented tight control of free reagent concentrations.
Results
After implementation, it became possible to achieve: 24/7 detection. with detection information every. 10 minutes. and data collection at a level of. 150 points per day / 50 thousand per year., enabling incident analysis and problem source localization.
Case study 2
Chemicals and polymers: synthetic resin production.
Challenge.
Unstable production and issues achieving final reagent concentrations, long laboratory response times, and lack of strict control over free reagent concentrations.
Results
After implementation, the measurement covered from. 750 points. (every. 30 seconds.) throughout the entire process, with relative errors against the reference method (HPLC) including. 0.02% for phenol. i 0.05% for formaldehyde.. Additionally, there was. batch time reduction (~6%). thanks to predicting the reaction endpoint and full quality documentation of batches.
See other Spectrally analyzer use cases
Feasibility Assessment of Using Raman Spectroscopy for Differentiating Batches of White Paints and Identifying Mineral Filler Markers
In white paints, even minor formulation changes, particularly in the area of fillers and mineral additives, can translate into tangible production and performance parameters: viscosity, stability, opacity, whiteness, or susceptibility to sedimentation. The problem arises when differences only become apparent after a batch is completed or after a longer period, for example, in a customer complaint.
Raw Material Identification for Adhesives in Seconds – Mobile Supply Control with Spectrally
In adhesive production, key raw materials – acrylate monomers, solvents, and isocyanates – arrive at the warehouse in various packaging types and from different suppliers. In practice, this necessitates rapid verification of whether the material on the pallet is exactly what was ordered and whether its purity meets the formulation requirements.
Real-time quality control of alkyd resins: correlation of viscosity and acid number with Raman spectrum
For alkyd resins in solvents, the key quality parameters—viscosity and acid number—are most commonly verified using laboratory methods on samples taken after filtration. This approach ensures precision but introduces a significant delay between production and quality decisions.
Check Spectrally in your process.
If you are considering inline analysis, the most important question is: will this method work under your conditions and deliver a result on which a decision can be based? Therefore, we start with a practical verification — using your samples and in the context of a specific goal (quality stabilization, batch shortening, contamination detection, loss reduction). In a short time, you get a clear answer:, whether measurement is possible, with what accuracy, where to install the measurement point. and how to translate data into real operational actions (trend, alarm, PASS/FAIL decision).
What you get as part of the application verification.
- Quick feasibility assessment.: whether the Spectrally system is suitable for measuring your process.
- Measurement point recommendation.: where to measure so the result is stable and useful for the process (in-line / at-line / mobile).
- Preliminary model and result format.: trend, alarms, thresholds, PASS/FAIL — i.e., a result understandable for production and the quality department.
- Step-by-step implementation plan.: installation scope, integrations, commissioning, and team workflow after startup.
- Return on investment estimation.: which sources of losses and risks we address and how quickly this investment can pay back.
Frequently Asked Questions
Do you implement solutions only in the industries listed on the website?
No. The list shows areas where we have the most implementation experience, but process analytics can also be adapted to other applications — the decision is made after a brief discussion and sample verification.
How to check if the technology will work in my process?
We start by identifying critical points (what and where to measure), and then conduct a short feasibility study using samples from your process. This way, you immediately know whether we can achieve the required accuracy and what the boundary conditions are.
In which applications do companies gain the most?
The greatest impact is where laboratory results are „after the fact” and do not allow process control, and deviations generate raw material losses, complaints, or downtime risks. In such cases, frequent or continuous measurement enables faster response and quality stabilization.
Does the solution operate in 24/7 mode and under harsh conditions?
Yes — process implementations are designed for continuous operation and real installation conditions (temperature, pressure, working environment). Configuration selection depends on the medium and measurement location.
Is this a solution for production or more for the laboratory?
Both scenarios are possible. Depending on the industry and process, we select the architecture: measurement. in-line. (in-process), at-line/lab. (in-line control during production) or portable (incoming quality control/IQC).
Is it possible to detect incidents „in real-time” in the water and wastewater industries?
Yes. In such applications, response speed is crucial, which is why implementations are designed to detect events in real-time (with a short measurement interval), rather than only after laboratory results are available.
What are the limitations of the method?
The most common limitations depend on the sample (e.g., fluorescence) and require proper selection of configuration and chemometrics. Therefore, we verify this in a feasibility study using your materials.
Can I implement this first at a single point and then scale up?
Yes — we often start with one critical point to confirm the business value and gather process data, then expand the system to additional stages or lines. This is a safe approach for implementation and cost control.
Will I receive a „readable result,” not just spectral data?
Yes. The result is presented in an operationally useful format (e.g., trend, alarm, PASS/FAIL, quality indicator), not as raw spectra. This allows personnel from technology, quality, and maintenance to all utilize the solution.
What information is needed to start a discussion about implementation?
A brief process description (medium, measurement point, business objective) and information on which parameters you currently control and at what frequency is sufficient. If we proceed to testing, we will define the minimum sample set for a feasibility study.
When will I receive information on whether this method makes sense for my process?
Initial conclusions emerge after process analysis and preliminary sample testing — at that point, we can determine feasibility, expected accuracy, and the recommended implementation architecture.