
In 2026 polymers Specialty materials — thermoplastic composites (TPC), high-thermal-stability resins, biopolymers, and fiber-reinforced copolymers — are growing at a rate that no longer fits within the traditional laboratory control cycle. Free monomers, C=C conversion, additive distribution, and the polycondensation endpoint are parameters for which the reactor does not wait: a batch reaches specification within minutes, while the laboratory result returns an hour later. This gap becomes costly, especially where specialty chemistry enters contracts for aerospace, medical composites, or certified recyclates.
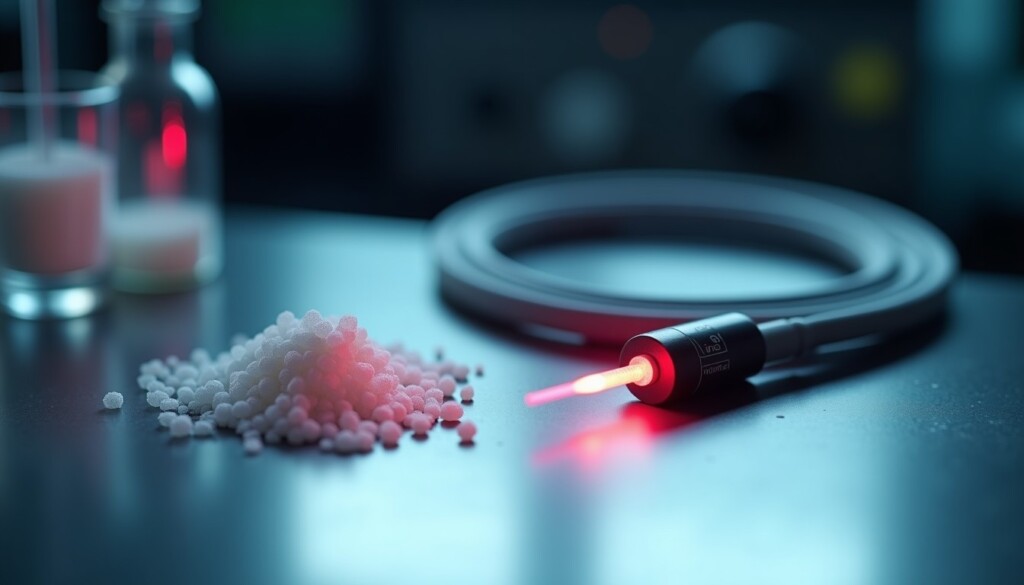
The response increasingly chosen by production plants in Europe is to move spectroscopic measurements from the laboratory into the process. Raman spectroscopy — using optical fibers to guide the probe directly into the reactor — provides an answer in 5–30 seconds and operates 24/7 without sampling. Below are four directions where movement is visible in the first half of 2026.
Thermoplastic composites and serial production — the end of the single-piece era
The composites industry in 2026 is clearly turning toward thermoplastic composites (TPC), automated fiber placement (AFP), and resin transfer molding (RTM). This is a response to three parallel pressures: reinforcement (increased production of UAVs and defense platforms), the requirement for shorter cycle times in automotive, and expectations for field repairs that thermosets could not meet. TPCs with PEEK, PPS, or PAEK matrices are entering areas previously dominated by epoxy resins — with the difference that the process is controlled by temperature and consolidation speed, not by crosslinking duration.
For process monitoring, this means a shift in the question: instead of „has crosslinking finished,” we ask „has the matrix crystallinity in the laminate reached the target fraction.” Raman answers both questions based on the same signal — polymer backbone bands in the 1000–1650 cm⁻¹ range change relative intensity depending on the degree of chain ordering. In practice, this reduces reliance on off-line DSC at the end of the line.
Raman in polymerization — from styrene-DVB proppants to phenol-formaldehyde resins
An illustration of how far the technique has advanced is the work by Sosa Morales and colleagues from the first half of 2026 („Raman Spectroscopy for Monitoring Polymerization, Quality Control, and Additive Distribution in Styrene–Divinylbenzene-Based Proppants,”, Applied Spectroscopy). The team used a fiber-optic probe in a temperature-controlled microreactor, tracking monomer conversion, the formation of crosslinked structures, and additive incorporation in real time — based solely on C=C vibrational bands. The method provides insight not only into the degree of conversion but also into the homogeneity of additive distribution within the matrix, which for oil proppants determines mechanical resistance under reservoir pressure.
The same type of measurement — C=C bands, aromatic ring breathing around 1000 cm⁻¹, methylene group vibrations — has been working for years in the polycondensation of phenol-formaldehyde (PF) and urea-formaldehyde (UF) resins. The difference between laboratory and process is mainly boundary conditions: the probe must withstand reactor temperature, reactive medium, and polycondensate deposits on the optical window. Solutions for this class of chemistry are now standard — self-cleaning probes with retraction and flushing modules keep the optical window clean without interrupting the process.
Polymer recycling and sorting — DUV Raman breaks the black plastics barrier
A second clear innovation in the first half of 2026 is a breakthrough in sorting polymers with low NIR reflectivity. The work by Zada et al. from Journal of Raman Spectroscopy („Black Plastic Identification for Sorting and Recycling With Deep-UV Raman Spectroscopy”) shows that a Raman spectrometer operating in the deep UV identifies layered and black polymers that have been a blind spot for hyperspectral NIR for decades. Previously, carbon black absorbed both the Raman laser excitation (785 nm and 1064 nm) and the NIR spectrum — identification ended there.
Deep-UV bypasses this problem because it excites in a range where carbon black does not act as a universal absorber, while simultaneously resonantly enhancing aromatic polymer bands. For recyclers, this means that ABS, PS, and PC fractions with graphite fillers no longer end up in mixed waste. The method has limits — it still requires 10–60 seconds of acquisition per sample and is hardware-wise more expensive than NIR — but it enters areas where NIR had to capitulate.
In parallel, classic 785 nm Raman still dominates in raw material identification at the warehouse gate and verification of certified PE/PP/PET recyclates. For this task, a portable analyzer with a spectral library suffices — a PASS/FAIL decision in a dozen seconds, without sampling.
Bio-polymers, chemometrics, and AI — three trends converging in the process
Market reports for 2026 show that biopolymers and renewable-source-based thermoplastics constitute a growing share of new market introductions. The chemistry is more diverse than in petrochemistry the classic range — PLA, PHA, bio-PET, composites with natural fibers — and each has its own Raman fingerprint. PLS or CNN models trained in spectroscopic platforms now handle multiple material classes in a single method, with model drift monitoring in the background. Deep learning is also entering the prediction of mechanical and thermal properties from the spectrum — before physical synthesis, as a first screening filter.
For the production operator, something other than the model name is important: the analytics layer must be consistent between the laboratory (model calibration on reference samples), inline (production), and portable (field audit). Separating systems results in costly model retraining at each transition.
Gekko Photonics solutions for process polymer monitoring
We have the most implementations in process chemistry — phenol-formaldehyde resins, urea resins, cosmetics, fertilizers, adhesives, hydrocarbons. In these chemistries, we configure Spectrally X1 INLINE as a process Raman analyzer with an immersion probe inserted into the reactor or pipeline. The analyzer operates with a 785 nm laser and 600 mW power (30 mW ATEX version planned for June 2027), a thermoelectrically cooled CCD detector, and Modbus communication; standard up to two measurement channels and fiber optics up to 100 m. We equip the probe with a Retractex module — it retracts from the process, flushes the optical window, and returns to measurement without interrupting the cycle. This is a solution for media where polycondensate deposits, resin, or viscous organic phases close the probe window within hours.
In the quality control laboratory and for chemometric model validation, we deploy Spectrally X1 LAB — a benchtop analyzer with a 25-sample carousel and through-package analysis (through transparent packaging, without opening). For raw material identification at the warehouse gate, recyclate certificate verification, and on-floor auditing — Spectrally X1 PORTABLE in a suitcase with a touchscreen and built-in spectral library.
All variants share a common software layer Spectrally OS — it supports PLS, PCA, and CNN models, a library of ~28,000 reference spectra, CSV/PDF/RAW export, RBAC, and integration with DCS/MES via Modbus. The same chemometric model built on the X1 LAB transfers without retraining to the X1 INLINE.
Specialty polymers that fall outside our narrow specialization in PF/UF chemistry — TPC, PAEK, biopolymers, aerospace composites — we treat as a project area: we initiate feasibility on client samples, verify the match of Raman bands to the specific analyte and matrix, and only then configure hardware for the application. Polymer recycling is one such direction — we have completed feasibility studies on plastics sorting that serve as a starting point for discussions on further steps.
A broad overview of our analyzer family is in the section process analyzers. Industry context — on the page chemicals and polymers. A comparison of spectroscopic techniques for process chemistry — Raman vs NIR vs FTIR — is the subject of a separate review on the blog.
Frequently asked questions
Can Raman handle dark or colored polymers?
Classic 785 nm Raman has trouble with carbon black and deeply colored matrices — excitation is attenuated, and fluorescence from dyes overwhelms the spectrum. Solutions: switching to a longer wavelength (1064 nm) reduces fluorescence, and in extreme cases — such as identifying black plastics in recycling — Deep-UV Raman, described in 2026 by Zada's team in Journal of Raman Spectroscopy, comes into play. For our typical process chemistry applications (resins, biocomponents, adhesives, hydrocarbons), 785 nm is sufficient.
How does inline monitoring of TPC differ from monitoring thermosetting resins?
In epoxy or phenol-formaldehyde resins, the process endpoint is crosslinking — we measure the disappearance of reactive groups — for example, the ring breathing of the phenolic ring around 1000 cm⁻¹ changes its environment as polycondensation progresses, and carbonyl and backbone vibrations provide additional information on the endpoint. In TPC with a PEEK or PPS matrix, the process is physical — consolidation, crystallization — and we measure changes in the intensity of backbone bands dependent on chain ordering. The same probe, the same analyzer, a different chemometric model.
Can I deploy a single chemometric model for an entire product (recipe), regardless of raw material changes?
Usually yes, as long as the raw material spectrum falls within the calibration range. A change in PE supplier or recyclate source can shift peaks, and then Spectrally OS will detect this as model drift — alerts in the dashboard, log in the audit trail. We then add spectra of the new raw material to the calibration set and retrain the model. A full retraining typically takes 2–4 working weeks.
Does Gekko Photonics support applications in aerospace composites and TPC?
We have the most implementations in process chemistry — PF/UF resins, cosmetics, fertilizers, adhesives, hydrocarbons — and there we speak of a ready configuration. Aerospace composites and TPC we treat as a project area: we enter with feasibility on client material samples to check the match of Raman bands to the specific matrix and fiber before the client commits CAPEX. We apply the same scheme in polymer recycling, where we have completed preliminary studies.
How long does the implementation of a process Raman system for specialty polymers take?
The standard cycle in our practice is 3–5.5 months from the client workshop to a functioning inline system. This includes: feasibility on samples, chemometric model building on the X1 LAB, probe configuration for the process, installation, DCS integration, and validation tests. The return on investment, confirmed under industrial conditions, typically falls within 6–10 months — mainly from reduced analytical costs, shortened batch cycles, and reduced rework.
Test measurement and engineering consultation
At Gekko Photonics, we select the measurement technique for the specific chemistry — we start with a 30-minute conversation with an application engineer about the analyte, matrix, process conditions, and KPI target. A test measurement on the client's sample is typically performed within 2 weeks, and a feasibility report — with a recommendation on the variant (INLINE, LAB, PORTABLE) and chemometric model fit — is delivered within 10 working days from the completion of tests. The starting point is contact form or directly spectrally@gekkophotonics.com.