Six process values from one Raman spectrum.
Urea, total and nitrate nitrogen, ammonium, biuret and thiosulfate - each read inline, in the pipeline or reactor itself with no sample drawn, while the batch is still correctable. The offline lab methods stay as the reference; they stop being the gate.
One spectrum in. Six process values out.
In urea, UAN/RSM, AdBlue/DEF and biuret control, the ship-or-hold decision reduces to a handful of composition values - and most of them still come back from the lab after the reactor, tanker or blend has moved on. All six live in the Raman spectrum of the liquid, read inline - in the reactor, pipeline or mixer itself, with no sample drawn. Each is extracted by its own chemometric model, calibrated against your laboratory's reference values during feasibility.
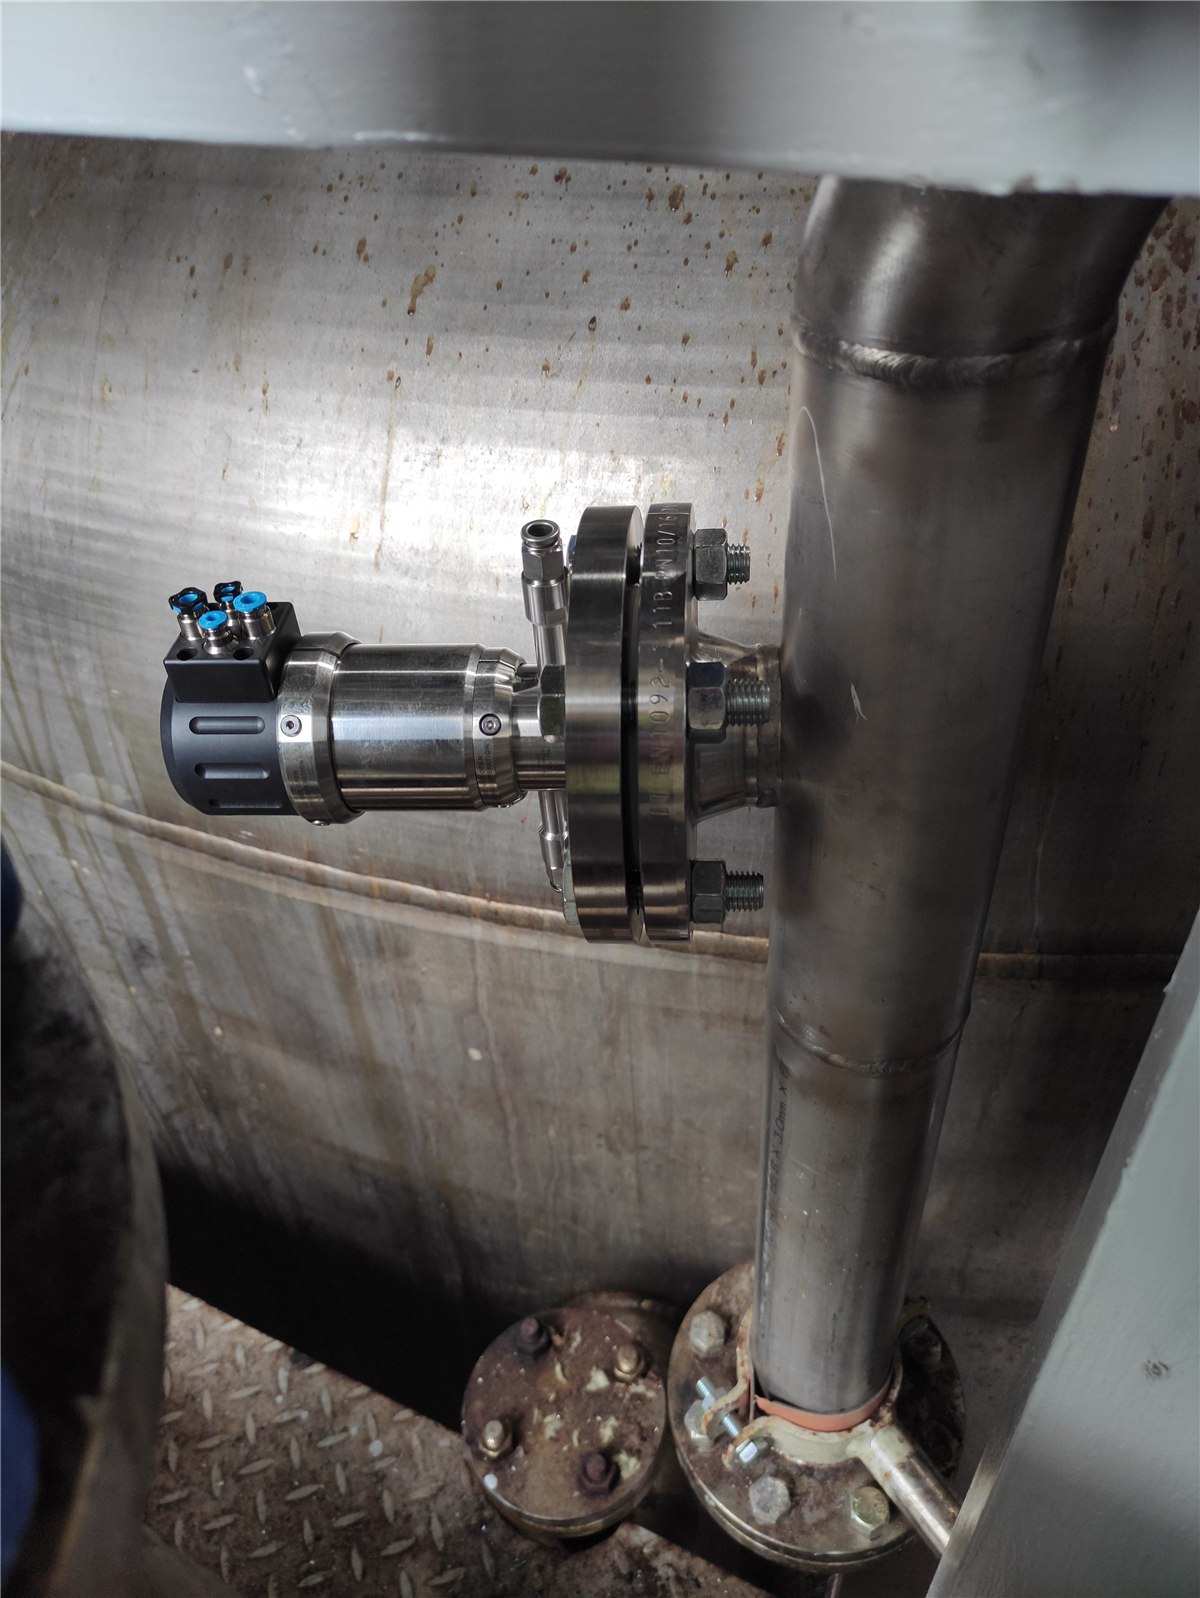
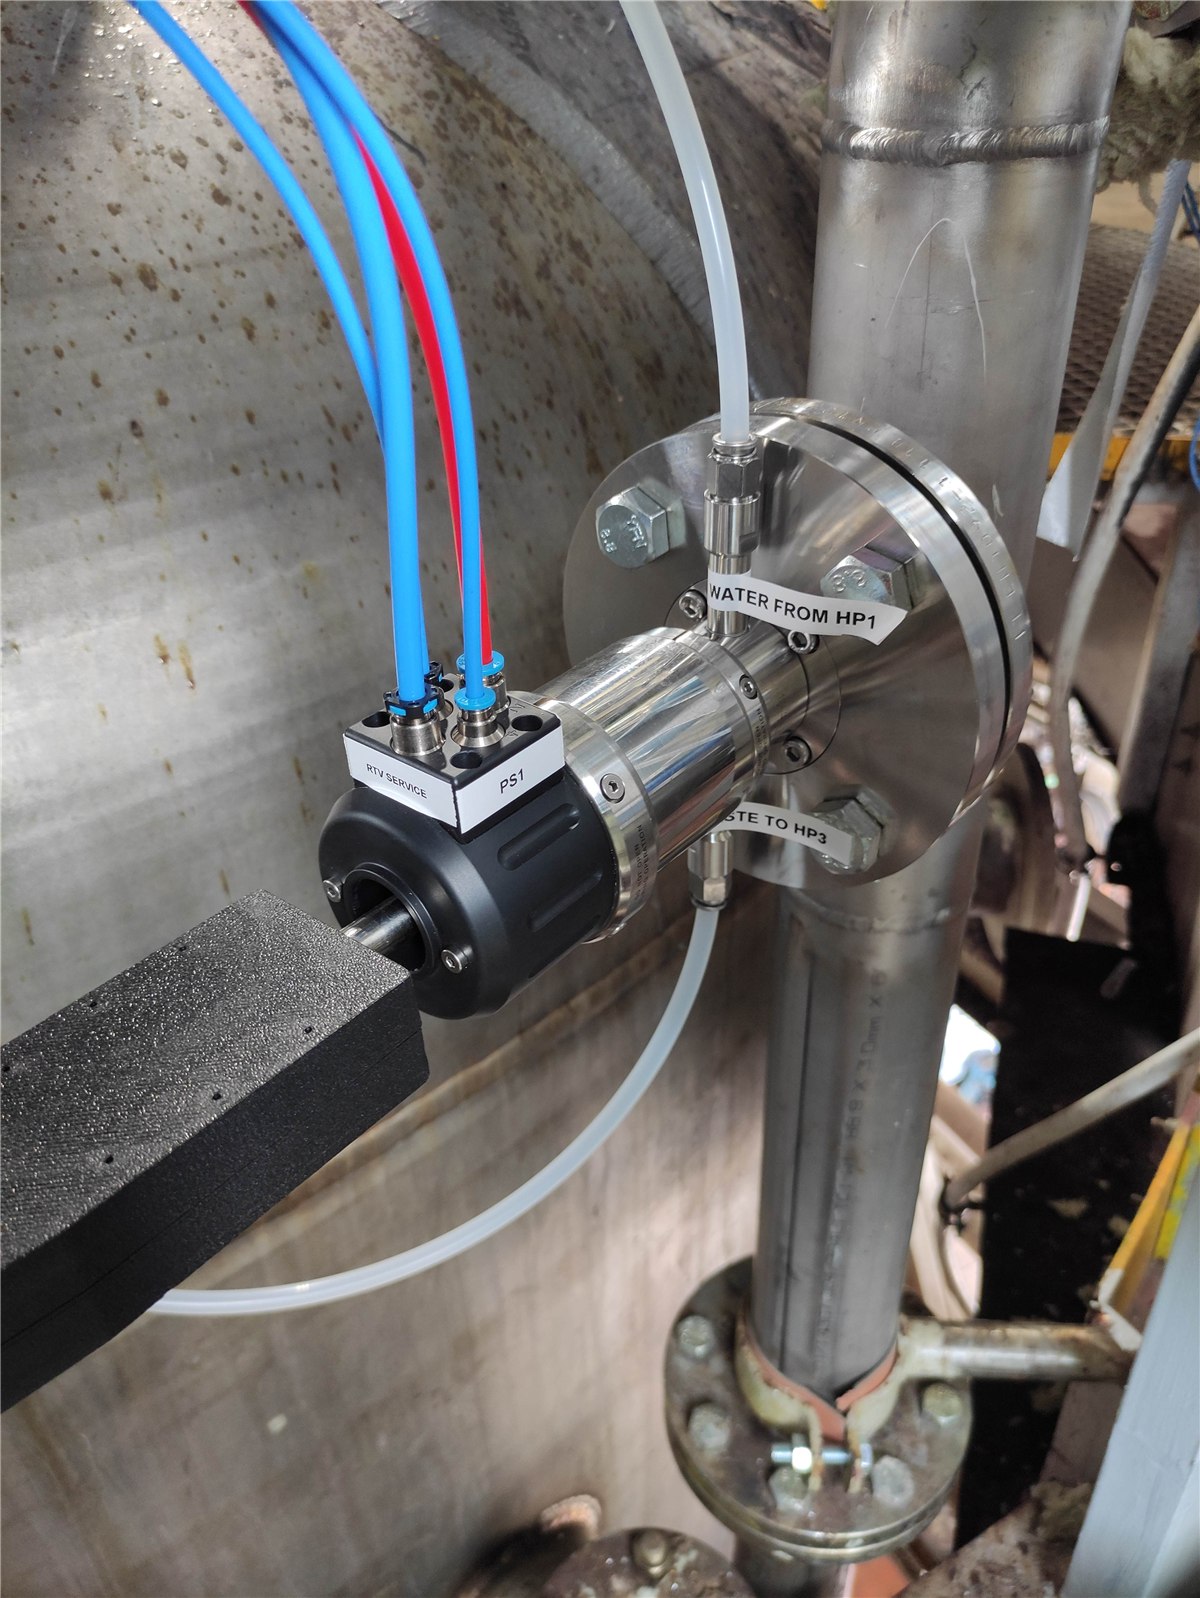
Laser excitation at 785 nm, with a 1064 nm variant for strongly fluorescent media. Spectral range 300-1650 or 300-3500 cm⁻¹ at 8 cm⁻¹ resolution. Water is a weak Raman scatterer, so aqueous nitrogen streams read cleanly.
A single acquisition takes from 5 s, inside a 5-300 s window. The batch or blend becomes a live curve instead of two or three lab points.
AI with advanced chemometrics and a CNN core in Spectrally OS, trained on your matrix and your product grades - not a generic library calibration.
Values arrive in the PLC / DCS over PROFIBUS and PROFINET, and onward to MES, SCADA and LIMS. Every measurement is stored and exportable as CSV, PDF or raw spectra.
The parameters that decide whether a batch or tanker ships.
Each value is pulled straight from the Raman spectrum by a dedicated chemometric model. Select a parameter to see where it lives on the spectrum.
Urea concentration - the master variable.
Urea is the main component of both RSM/UAN and AUS 32 DEF, so its concentration sets the final composition of the product. In most plants it is inferred - from a total-solids reading or from charge weights - rather than measured as a distinct species in the tank.
Why it decides the batch
Urea is the master lever for this whole family: 46% N as fertilizer, 32.5% urea in AUS 32 DEF, and the main component of RSM/UAN. In DEF the concentration has to sit inside the ISO 22241 window (32.5% ±0.7%) - off-spec solution damages the SCR catalyst and creates producer liability. In RSM it sets the declared %N a customer will claim against.
How it is read today
By proxy or by arithmetic. Refractometry returns total dissolved solids in 2-3 min but cannot tell urea from ammonium nitrate and sees no biuret; charge weights verify the recipe, not the tank. Confirming real urea content means the Kjeldahl loop at 60-90 min.
What reading it inline changes
Urea concentration comes straight off the spectrum, a fresh value every few seconds, per batch and at each dosing, tanker or IBC fill. Raman intensity is proportional to concentration, and the aqueous matrix reads cleanly. During feasibility the reading is calibrated against your laboratory reference before any number is trusted on the line.
Total nitrogen - the number on the label, read from the spectrum.
Total nitrogen is the value the label is built on. Under Regulation (EU) 2019/1009 it is a legally declared parameter that determines the CE fertilising-product class, so it is reconciled by every buyer and, where required, by a Notified Body.
Why it decides the batch
Total N is declared and regulated - it sets the CE fertilising-product class. Any deviation from the declared %N is exactly what a customer claims against, which makes it the certificate value under the closest scrutiny.
How it is read today
The certification route is Kjeldahl at 60-90 min, or Dumas combustion - both destructive, both a lab loop away from the granulator or the tank. The declared class waits on that result.
What reading it inline changes
In feasibility on fertilizer granules, total N was read in native form with no sample preparation, across the full declared range, from the nitrate band near 1050 cm⁻¹ with peak area as the best descriptor - a very strong linear correlation, R = 0.91 on raw data. The same read also picked up the organic coating and, tentatively, dolomite.
Nitrate nitrogen - a clean, isolated band.
Nitrate nitrogen (N-NO3) is the nitrate half of ammonium nitrate - the AN component of UAN and RSM - and the marker that shows up in effluent. It gives Raman one of its cleanest signals in this family.
Why it decides the batch
N-NO3 is one of the two major nitrogen indicators in UAN/RSM, and the regulated species in effluent under the Nitrates Directive (91/676/EEC). Its concentration has to track the declared composition.
How it is read today
Offline it means ammonium-nitrate titration at 20-30 min, Kjeldahl at 60-90 min, or ion chromatography - each a pulled sample and a wait.
What reading it inline changes
Nitrate gives a strong, isolated band near 1044 cm⁻¹ (the ν₁ symmetric stretch), read by direct band integration with no deconvolution. In feasibility at an ammonium-nitrate producer the repeatability was about 0.0004 a.u. standard deviation, and the nitrogen chemistry transfers directly to UAN/RSM.
Ammonium nitrogen - recovered through the water background.
Ammonium nitrogen (N-NH4) is the other major indicator in ammonium-nitrate-based fertilizers. Its own vibrations sit under the broad water background, so it is the one parameter here that Raman reaches through a model rather than a clean band.
Why it decides the batch
N-NH4 completes the declared %N picture in RSM/UAN and in ammonium-nitrate streams. It is a specified value, not a nice-to-have, and it pairs with nitrate N to account for the total.
How it is read today
Offline it is Kjeldahl or titration, tens of minutes per sample. In the raw spectrum the N-H bands (roughly 3030-3335 cm⁻¹) are masked by the broad water O-H region, so they are not directly observable in the current configuration.
What reading it inline changes
A chemometric model on the full spectrum recovers it. Validated on ammonium-nitrate standards spanning 2.01-10.76% N-NH4, it reached a high R² with a mean prediction error near 0.069% across that range. For ppm-level ammonium in effluent this needs an optics change - a smaller grating - and calibration on the real stream, stated plainly rather than implied.
Biuret - the by-product you currently wait 40 minutes to see.
Biuret forms when two urea molecules condense above 135 °C in the reactor. It is capped tightly because of what it does in the field, and it is the classic case where a slow offline method arrives long after the excursion.
Why it decides the batch
Biuret is toxic to plants from about 0.5%: it blocks the urease enzyme and inhibits growth. Regulation (EU) 2019/1009 and IFA practice hold it below 1% by weight in fertilizer urea for CE, and below 0.5% in RSM; ISO 22241 limits it in DEF. Too high means disposal or a lower price.
How it is read today
Offline detection is slow: gas chromatography at 40-60 min, HPLC at 20-30 min, or DMAB colorimetric titration at 15-20 min - all well after the reactor has passed the temperature that made the biuret.
What reading it inline changes
Followed inline during urea production or RSM mixing, the biuret trend becomes visible early enough for operators to correct before the batch goes off-spec, rather than confirming the excursion after the fact. Spectrally OS carries biuret in its regression list; feasibility on your own material fixes how tightly it reads.
Thiosulfate and the N/S ratio - the neighbour sulfur chemistry.
Ammonium thiosulfate (ATS, 12% N + 26% S) is the neighbour sulfur chemistry - a sulfur fertilizer and nitrification inhibitor, dosed into UAN or run on its own. It belongs to the adjacent family, so it is covered here only in outline.
Why it decides the batch
The thiosulfate concentration and the N/S ratio both have to hit spec; a deviation shows up as a customer complaint and a CE-documentation problem.
How it is read today
Offline that is iodometric titration at 20-30 min, ion chromatography at 30-60 min, or densitometry - the same wait as the rest of the family.
What reading it inline changes
Thiosulfate concentration and solution homogeneity read inline from the same spectrum, alongside the nitrogen values when ATS is blended into UAN. Feasibility on your material sets the accuracy figure for your chemistry and puts it in your hands, validated against your reference method.
What comes off your critical path.
None of these methods disappears. They move from real-time gatekeeper to periodic verification - and the ship-or-hold decision stops waiting for them. Trace-metal certification - iron, calcium, sodium - stays on ICP, where it belongs; Spectrally owns the composition side inline: urea, nitrate, ammonium, biuret and homogeneity.
See these six values measured on your own urea, UAN/RSM or DEF.
Send representative samples or process data from your urea, UAN/RSM, AdBlue/DEF or biuret stream. We build and validate the chemometric models on your matrix and report which of the six parameters inline Raman reads on your line, and how accurately, before any commitment. Trace-metal limits (Fe, Ca, Na) stay with ICP - we say so up front.