Six parameters that decide whether a batch ships.
Molar ratio, free formaldehyde, free phenol, solids, cloud point and the condensation endpoint - each pulled straight from the Raman spectrum by a dedicated chemometric model.
One spectrum in. Six process values out.
In PF, UF, MUF/MF and UFC production, the batch decision reduces to a handful of composition values - and most of them still come back from the lab after the reaction has moved on. All six live in the Raman spectrum of the reaction mixture. Each is extracted by its own chemometric model, calibrated against your laboratory's reference values during feasibility.
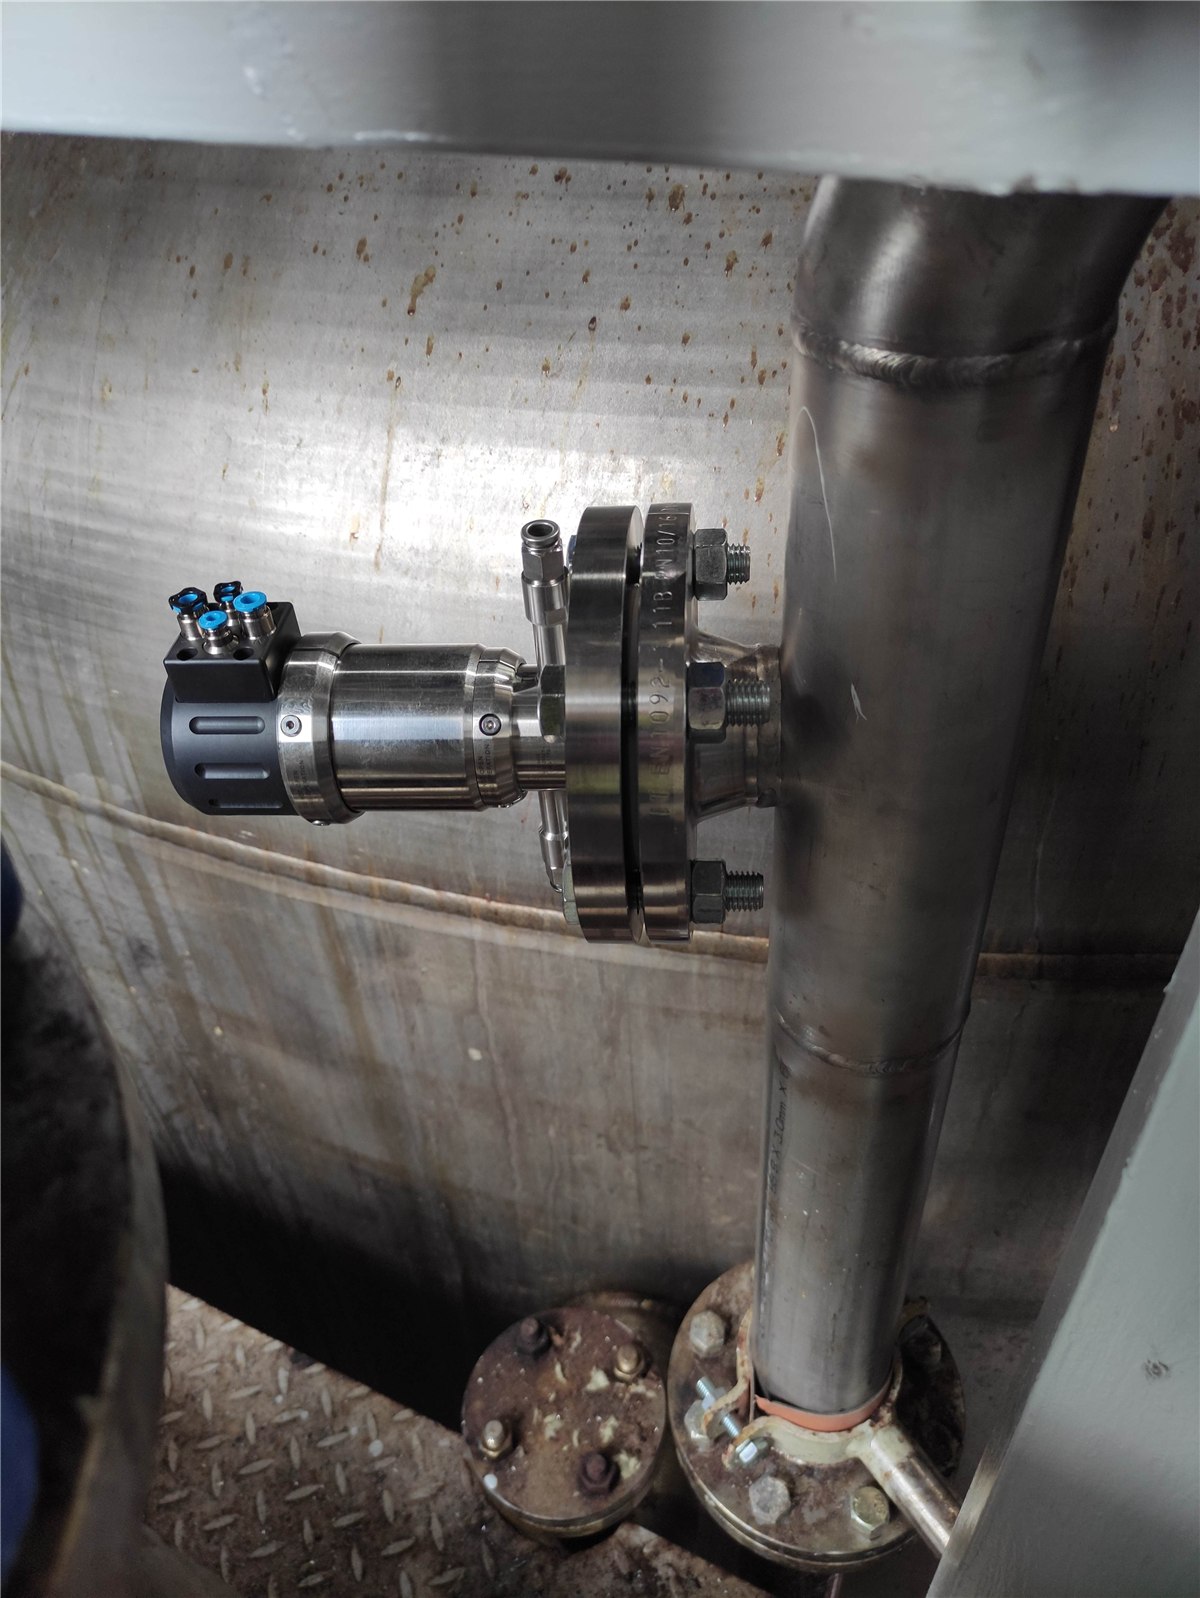
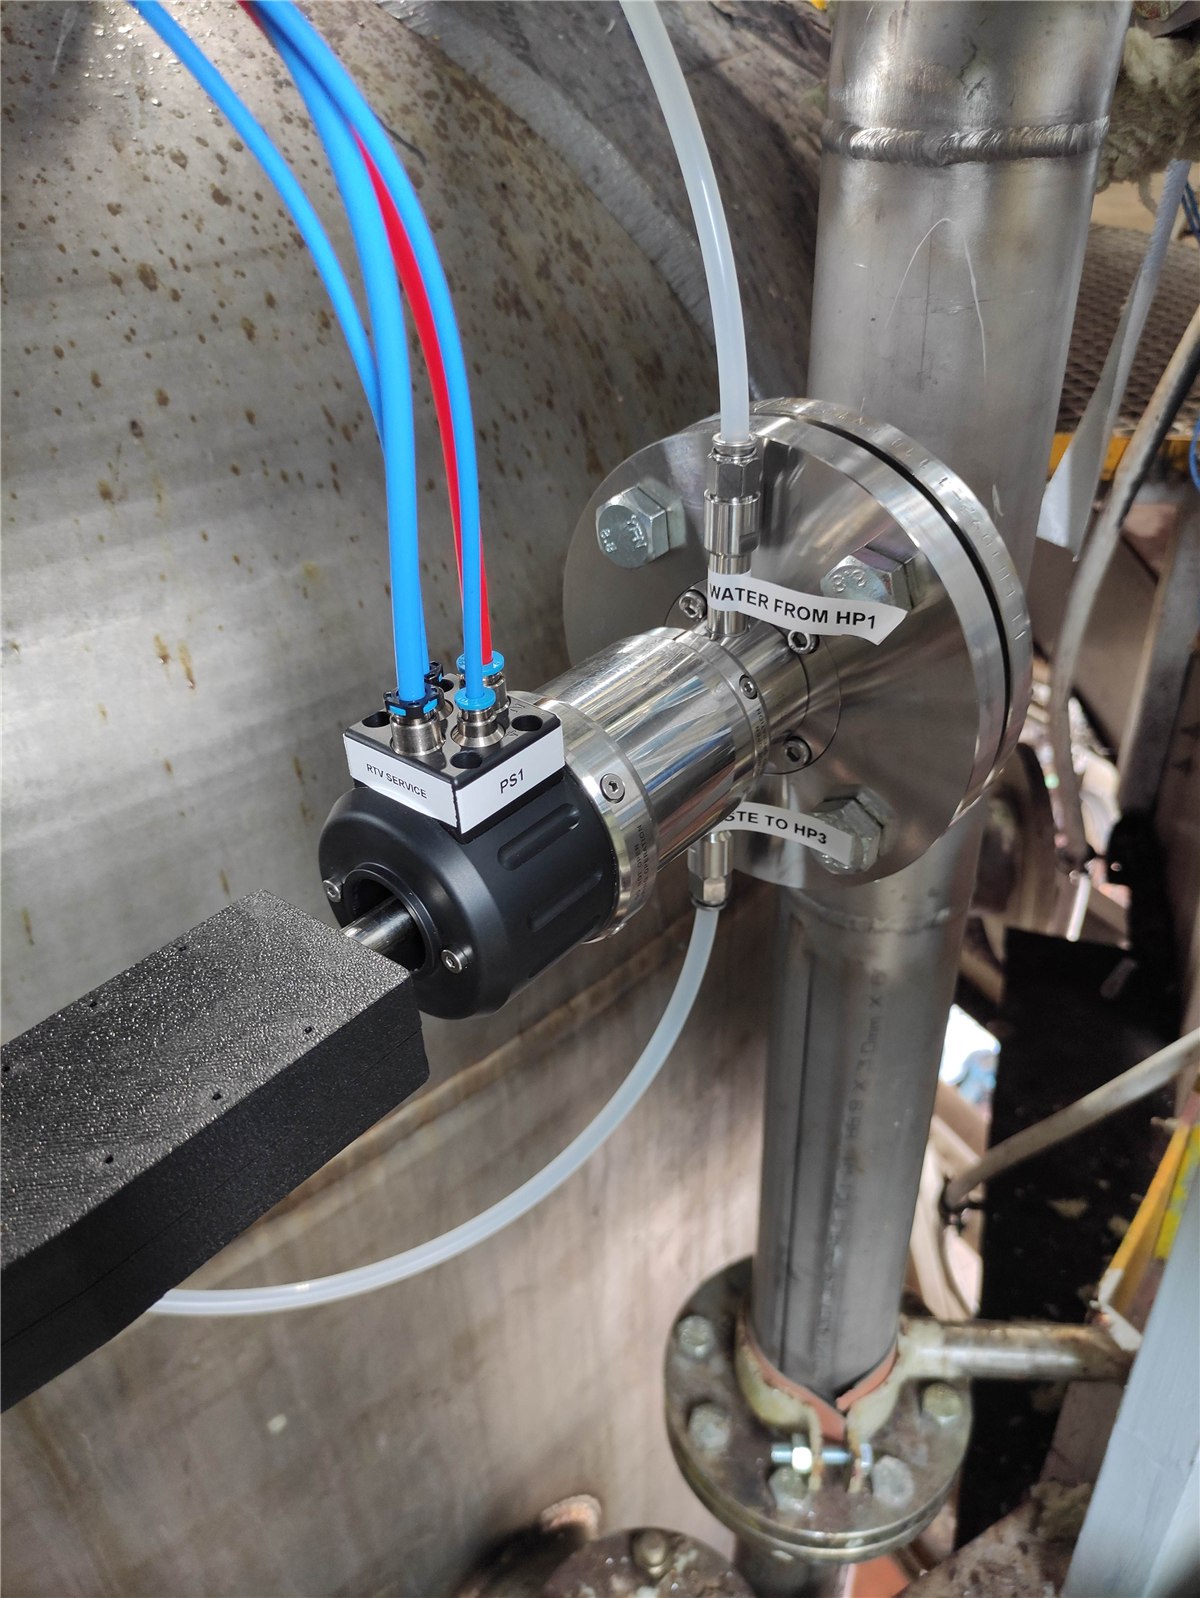
Laser excitation at 785 nm, with a 1064 nm variant for strongly fluorescent media. Spectral range 300-1650 or 300-3500 cm⁻¹ at 8 cm⁻¹ resolution.
A single acquisition takes from 5 s. The batch trajectory becomes a live curve instead of two or three lab points per cook.
CNN, PLS and PCA models in Spectrally OS, trained on your matrix and your recipes - not a generic library calibration.
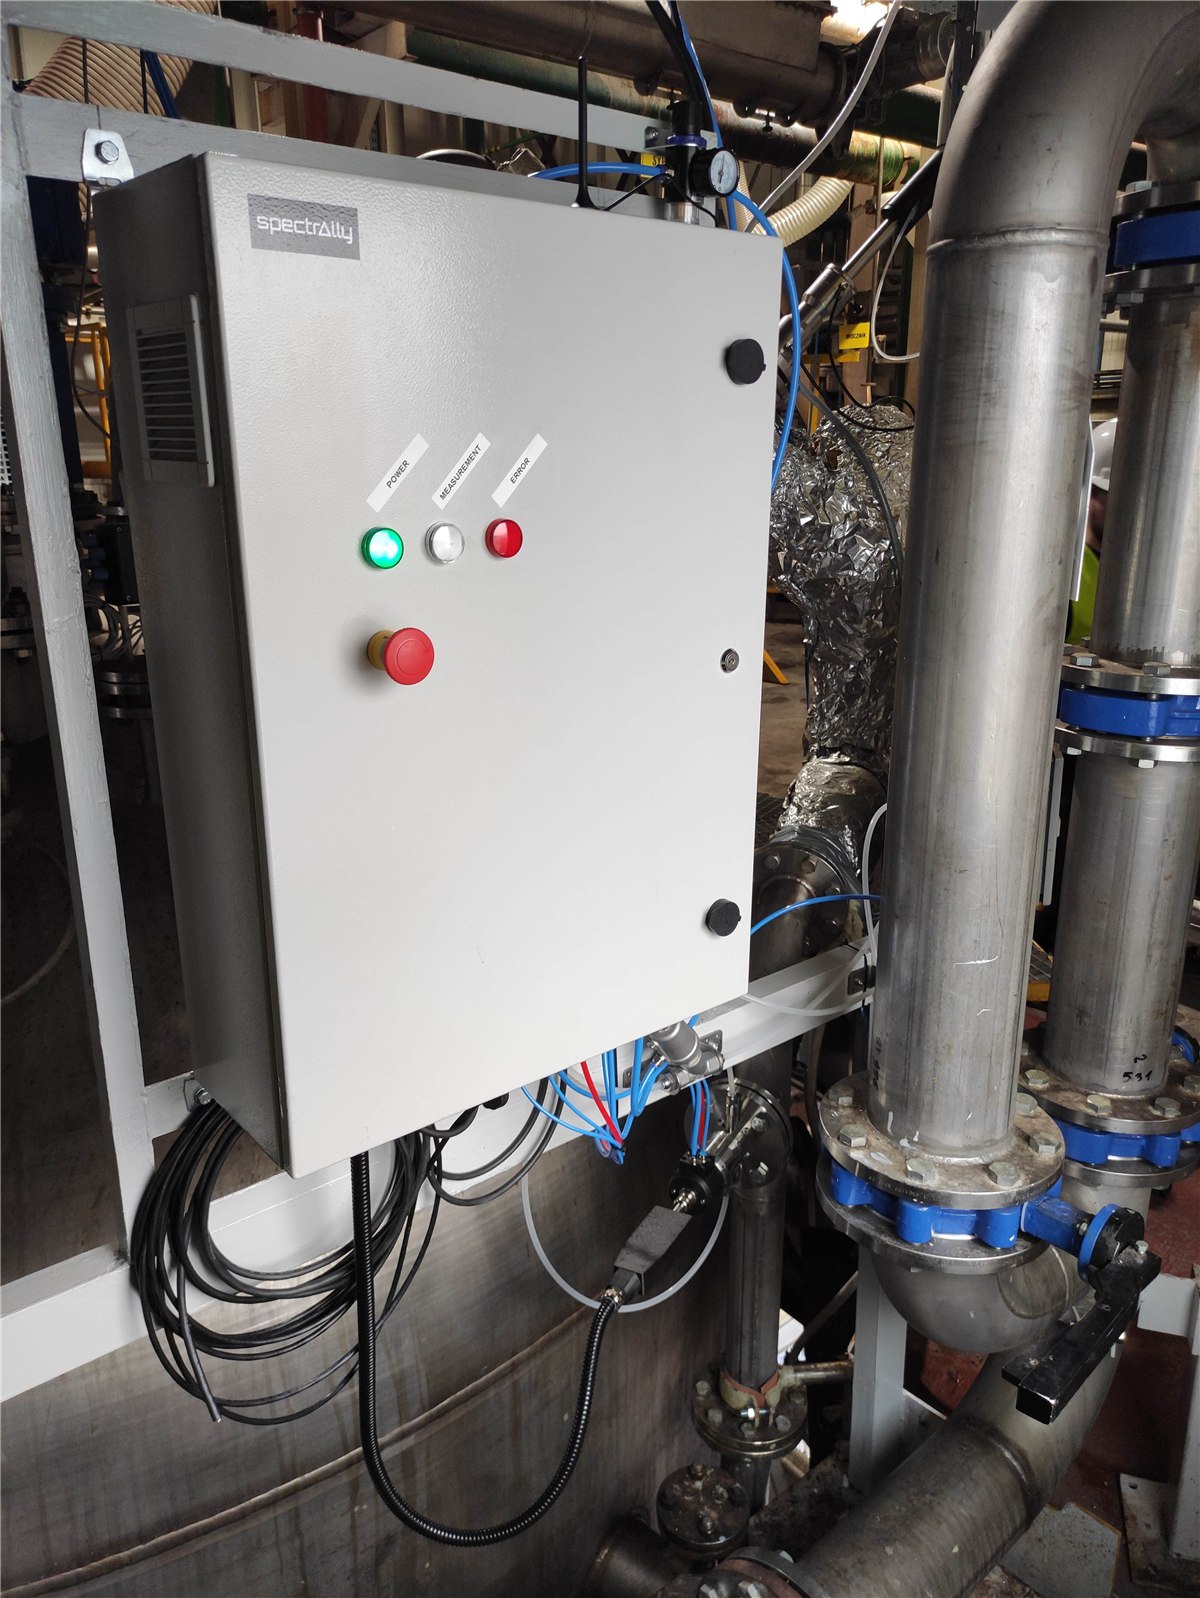
Values arrive in the PLC / DCS over Modbus. Every measurement is stored and exportable as CSV, PDF or raw spectra.
The parameters that decide whether a batch ships.
Each value is pulled straight from the Raman spectrum by a dedicated chemometric model. Select a parameter to see where it lives on the spectrum.
F/U & F/Ph molar ratio - the master variable.
The formaldehyde-to-urea or formaldehyde-to-phenol ratio sets the reactivity of the finished resin and the cure behaviour your customer sees. It drifts during the reaction, differs batch to batch - and in most plants it is never actually measured in the reactor. It is assumed from the charge weights.
Why it decides the batch
In UF - the binder behind more than 80% of the wood-panel resin market - F/U governs reactivity, and a small ratio drift becomes a big reactivity swing downstream. In MUF/MF the F/M/U split also carries cost: melamine is several times the price of urea, and a ±5% dosing error moves both the margin of the batch and the emission class of the laminate.
How it is read today
Usually by arithmetic: the ratio is computed from charge weights, which verifies the recipe, not the reactor. Confirming real composition means HPLC - 30-60 min for residual urea, 60-90 min for melamine, sample preparation included. Incoming UFC adds its own uncertainty: F/U varies ±5-10% between suppliers and deliveries.
What reading it inline changes
The ratio comes straight off the spectrum while the batch is still correctable, with a fresh value every dozen or so seconds. At UFC intake - concentrate arriving at roughly 85% solids, F/U around 4.7 - the actual ratio is verified in 1-2 minutes at-line, so charge weights are corrected for each delivery instead of trusting the certificate.
Free formaldehyde - tracked live instead of titrated later.
Residual HCHO is both a reaction-progress signal and a documented quality parameter. Customers specify limits for it, and for US-bound composite wood, CARB ATCM 93120 requires free-formaldehyde documentation per batch.
Why it decides the batch
Free HCHO is what the condensation has not yet consumed, so it tracks the reaction itself. It is also spec'd: E0/E1 emission classes under EN 717-1 require documented resin composition, and exceeding a customer's residual limit can turn a full reactor into waste.
How it is read today
Sulfite titration to EN 120: a sample pulled by hand every 10-20 minutes, the result landing 30-45 minutes later - describing a reactor state that no longer exists. Each pull also means a technician and direct HCHO handling. In formalin and UFC streams the equivalent is titration to ISO 9020, with the same class of lag.
What reading it inline changes
HCHO is tracked continuously, with no sampling and no reagents. Feasibility on real PF reaction mixtures: mean absolute error around 0.21 pp against the reference method. Each batch closes with a continuous free-HCHO record instead of two or three titration points - documentation resting on hundreds of measurements.
Free phenol - the PF endpoint you currently wait for.
In PF production, residual phenol tracks the condensation and decides whether the batch is on-spec. Phenol sits on the ECHA SVHC candidate list, and receiving specifications require it monitored.
Why it decides the batch
Batch-to-batch variance in F/Ph shows up at your customer as inconsistent reactivity. The phenol left in the resin is a specified, scrutinized value - and it falls as the reaction runs, so it doubles as your progress signal.
How it is read today
Offline HPLC: 20-40 minutes plus sample preparation, dedicated equipment and an analyst. The condensation does not pause for the result - over-react inside that window and the batch goes to disposal.
What reading it inline changes
Phenol reads from its aromatic ring band near 1000 cm⁻¹, continuously through the synthesis. Feasibility on real PF reaction mixtures: mean absolute error around 0.03 pp versus the reference method - a value you can steer the endpoint with, not just confirm it by.
Resin solids / NVM - composition, not just an index.
Non-volatile matter is the plainest number on the certificate and one of the first a customer reconciles. A classic inline reading exists - refractometry - but it compresses the whole batch into a single solids index.
Why it decides the batch
Solids define the grade. They have to hold consistent from batch to batch and from plant to plant - and every downstream dilution and dosing step assumes they do.
How it is read today
Refractometry - inline or bench - measures total solids and nothing else. In UF chemistry it cannot tell urea from its methylol derivatives, so two batches with the same index can carry different chemistry. Densitometry, common at UFC intake, makes the same trade: an indirect concentration signal without composition.
What reading it inline changes
Solids come off the same spectrum as ratio and free monomers - one probe, several parameters, all from the same instant in the batch. The single refractive index becomes a cross-check instead of the only inline number you have.
Cloud point / water tolerance - the melamine endpoint.
In MUF and MF systems, cloud point and water tolerance are the endpoint indicators - and the offline routines for catching them are slow and awkward at exactly the moment when timing matters most.
Why it decides the batch
Melamine is added to the UF base to raise water and temperature resistance. Cloud point and water tolerance are how that build-up shows itself during the cook - which makes them the natural endpoint signals for melamine systems, and ties them directly to the batch's most expensive raw material.
How it is read today
Offline, on pulled samples - between pulls the batch runs unobserved. Verifying what the melamine actually did means HPLC at 60-90 minutes including preparation, so a dosing error typically surfaces after the reactor is already empty.
What reading it inline changes
The endpoint indicators are read continuously, and the spectrum carries multi-component composition - F/M/U and free formaldehyde - in a single read. Melamine dosing is controlled during the reaction rather than reconstructed after it.
Condensation endpoint - stop on the measurement, not the margin.
The condensation has to be stopped at the right point: too early and the resin is under-condensed, too late and the batch gels in the reactor. Everything else on this page feeds this one decision.
Why it decides the batch
The endpoint decides whether the batch ships or over-condenses into scrap. Between lab results, crews steer by time, temperature profile and viscosity impressions - experience bridging a measurement gap.
How it is read today
Offline viscometry on a sample roughly every 10 minutes - an indirect proxy for reaction progress that says nothing about composition. Ten minutes is a long time at the end of a cook.
What reading it inline changes
Viscosity is inferred from the Raman spectrum alongside composition. On real resin during synthesis, regression models reach R² > 0.99 with uncertainty around ±0.25 Pa·s - a live endpoint read, so batches stop at the measured endpoint instead of a conservative time margin.
What comes off your critical path.
None of these methods disappears. They move from real-time gatekeeper to periodic verification - and the batch decision stops waiting for them.
See these six parameters measured on your own samples.
Send representative samples or R&D data from your PF, UF, MUF/MF or UFC process. We build and validate chemometric models on your matrix and report which of the six parameters inline Raman reads on your line - and how accurately - before any commitment.