Not a promise - results on industrial matrices.
Feasibility studies on genuine process samples: what was measured, how well it correlated, and what your chemistry gets before anything is installed.
A validated measurement on your matrix - before any hardware.
A Gekko feasibility study answers one question: can Raman measure your parameter, in your chemistry, at the accuracy you need. Real samples, a chemometric model built for your matrix, and a report that states what works and what does not - before any instrument commitment.
The study runs in the Gekko lab on the benchtop Spectrally X1 LAB - the same measurement and model stack that later runs on the Spectrally X1 INLINE at your line. What you see in the report is what the analyzer will read in production.
Your samples, measured against your reference method
Resins are not a generic matrix. Every result on this page comes from measurements on real industrial samples - process resins pulled from reactors during polycondensation, finished-product portfolios, resin solutions in organic solvent. Each study correlates the Raman spectrum with the method you trust today - rotational viscometry, titration - and reports the agreement it found.
- Measured on a Spectrally X1 Raman spectrometer - 785 nm laser, 8 cm⁻¹ resolution, 300-3500 cm⁻¹ range
- At-line in vials, in-line with an immersion probe, or on-site at the reactor with a mobile unit
- Model metrics reported against your reference values, limitations included

Representative process samples - vials, cans, reactor pulls - or existing spectra and reference datasets.
Full-spectrum models - band ratios, regression, CNN - correlated against your reference method, not against assumptions.
Spectra, band assignments, model metrics versus reference values, and a clear result: positive, partial or negative.
The study runs before any instrument decision. If the measurement does not hold up, the report says so.
Numbers first. The full studies follow below.
Three results from feasibility work on resin and formaldehyde matrices - each measured on genuine process samples and validated against the customer's reference method.
Phenol & formaldehyde during synthesis
Mean absolute error around 0.03 pp for phenol and 0.21 pp for formaldehyde versus the standard reference method - real-time tracking of the key reagents and a cleaner endpoint.
Acid value without classic titration
Chemometric models at R² > 0.99 with prediction error near 0.2 mg KOH/g - faster QC and far less dependence on lab titration.
Viscosity across the full reaction
Regression models at R² > 0.99 with uncertainty around ±0.25 Pa·s - a live read on the condensation endpoint and tighter spec control.
Four resin studies, reported as measured.
The studies are anonymized by policy - no producer names, no locations. Everything else stays: the chemistry, the numbers and the limitations, including the ones that still need work before a pilot.
Viscosity and acid value from one spectrum
A resin and dispersion producer controlled the two key quality parameters of its alkyd resins - viscosity and acid value - by offline viscometry and titration, with results arriving hours later. The study ran in two stages on alkyd resin in organic solvent (white spirit D40, xylene): at-line in 5 ml vials, then in-line with an immersion probe at about 2 scans per minute, without sample preparation.
- At-line stage: full-spectrum regression and CNN models reached R² > 0.99, with viscosity error near ±0.25 Pa·s and acid value near ±0.2 mg KOH/g
- In-line stage, CNN on process-stage samples: R = 0.998 for both viscosity and acid value on the first resin series; R = 0.988 and 0.982 on the second
- Working bands: aromatic rings near 1000 cm⁻¹, ortho-phthalate C-O-C near 1040 cm⁻¹, carbonyl near 1600 cm⁻¹ - the last tracking esterification progress
- The in-line data also caught samples still evolving between reference sampling and lab measurement - a drift the offline method could not see
Viscosity from band ratios, batch to batch
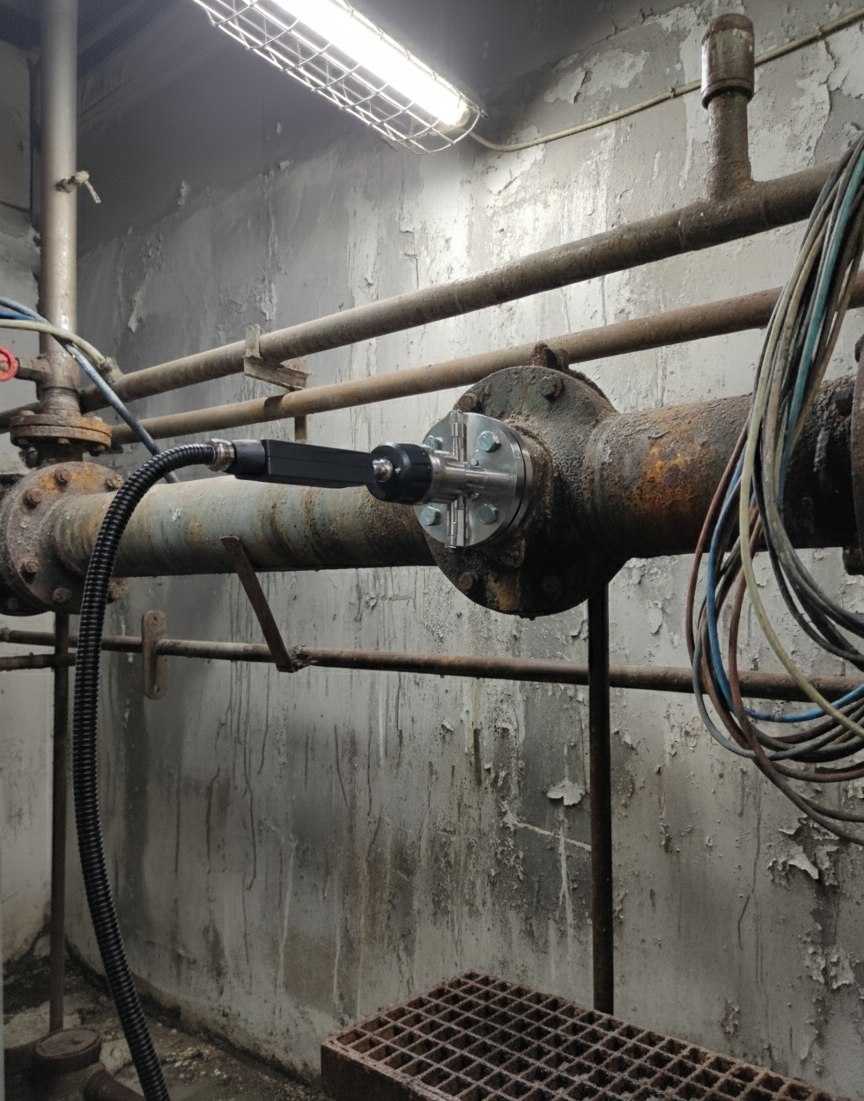
An amino resin producer runs polycondensation in batch reactors and controls viscosity by rotational viscometry in the lab - with dead time between sampling and result. The study ran on-site: samples pulled from the reactor during polycondensation were measured in parallel on the Raman system and the viscometer, in a signal window of roughly 340-1650 cm⁻¹.
- The band ratio I(897-930)/I(1000-1010) correlates positively and linearly with measured viscosity for the UF-Me process resin and for MUF - consistent across two production batches
- The 975 cm⁻¹ triazine band flags melamine and decides where the calibration transfers; plain UF (7 finished products, 33-2288 mPa·s) needs its own calibration
- Band ratios instead of absolute intensities compensate signal attenuation from sample turbidity - a practical advantage at deployment
- Stated limits: an offset between batches calls for more batches of known viscosity before a universal model. Recommendation: an in-line pilot with the probe in the circulation line
The kinetics that close the decision window
A wood-panel resin producer controls UF and MUF viscosity by manual sampling and offline rotational viscometry - against a polycondensation whose viscosity climbs slowly, then accelerates sharply. The study measured in-line across 20-400 cP in a 400-1600 cm⁻¹ window, at up to 10 scans per minute.
- Substrate and product tracked in parallel: the formaldehyde band at 902 cm⁻¹ falls linearly as it is consumed, the product C-O-C band at 840 cm⁻¹ rises, and 974 cm⁻¹ flags melamine in MUF
- MUF kinetics measured directly: roughly 30 minutes of slow build, then rapid acceleration - the reason point sampling misses the endpoint
- A preliminary viscosity model was built for both resins on the full spectrum; the reference base was small, so scatter remains at the range extremes
- Side finding: samples cool on the way to the viscometer and read high - a reference-method error the in-line measurement removes
An endpoint call for MUF
A MUF producer needed a product reference standard and a direct indication of the reaction endpoint - the moment urea stops reacting - correlated with viscosity, to steer polycondensation. Measurements ran with an immersion probe in a laboratory reactor.
- A preliminary in-line measurement procedure was established for the endpoint indication and the product reference standard
- Open item, stated in the report: air bubbles on the probe destabilized the signal in the lab reactor; the probe mounting must eliminate them before a pilot
- The path to an in-line endpoint call is realistic - pilot preparation is the next step
Eighteen studies. Not eighteen success stories.
The feasibility registry spans eleven industrial segments. Results are reported as measured: positive, partial or negative. Partial means feasible with stated conditions - usually more reference data or a pilot. One study came back negative, and the report said so.
Run on real customer samples across eleven industrial segments.
Alkyd, UF and MUF viscosity, and the MUF reaction endpoint - detailed above.
Plus 12 partial - feasible, with the conditions stated in the report.
Where the measurement did not hold up, the report said so.
From a crate of samples to a validation report.
The sequence is the same whether the study runs in the Gekko lab or on-site at your plant with a mobile unit.
Measured against your reference, not ours
Study samples are read in parallel on the Raman system and the method you trust today - rotational viscometry, titration. The model is only as good as its agreement with those values, and that agreement is what the report shows.
The mode matches your process
At-line in vials for screening, an immersion probe for process-like conditions, or on-site measurement at the reactor with a mobile unit. The four studies above used all three.
Limitations in writing
Batch offsets, sparse reference data, probe mounting issues - whatever the study finds goes in the report, together with what is needed to close it before a pilot.
What lands on your desk.
Every study closes with the same set of deliverables - the same ones the four resin studies above produced.
Measured spectra with band assignments, model performance against your reference values, and a clear statement of the result.
A chemometric model scoped to your chemistry - full-spectrum regression, CNN or band-ratio descriptor - with its validity range stated.
Where the measurement should sit - immersion probe in the reactor or in the circulation line - and the recommended hardware configuration for a pilot.
Open items and what closes them - additional reference batches, model extension, probe mounting - so the pilot decision rests on facts.
The hardware the model runs on
A positive study transfers to the process as Spectrally X1 INLINE with the immersion Spectrally X1 PROBE and its self-cleaning module, with Spectrally OS turning the spectrum into process values for your control system. The model built in the study becomes the starting point for pilot calibration under dynamic process conditions - the same chemistry, the same bands, on your line.
Run the next study on your resin.
Send representative samples or R&D data from your PF, UF, MUF/MF or UFC process. We measure them against your reference method, build a chemometric model on your matrix and report the result - positive, partial or negative - before any hardware commitment.