Six values that decide when to stop the reactor.
Acid value, hydroxyl value, the viscosity endpoint, monomer conversion, %solids / NVM and emulsion consistency - each read straight from the Raman spectrum by a dedicated chemometric model.
One spectrum in. Six process values out.
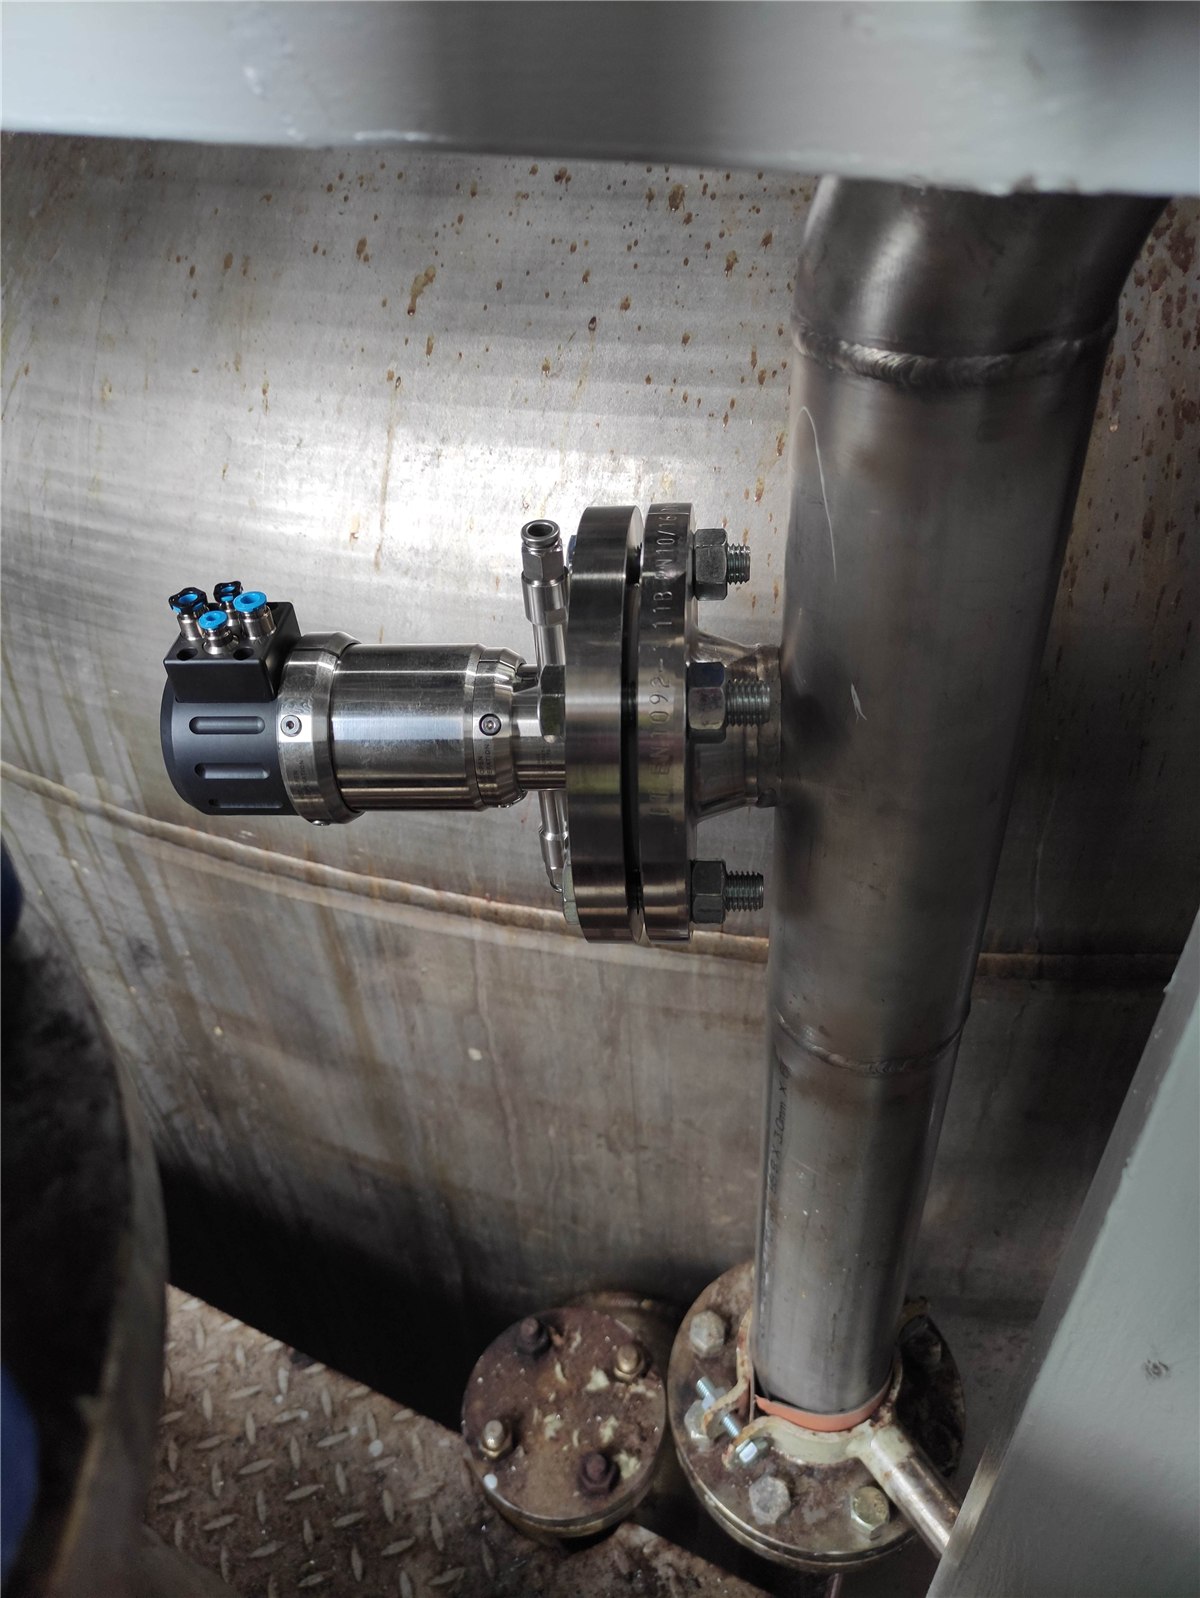
In alkyd, acrylic and composite-resin reactors, the batch decision comes down to a handful of composition values - and most of them still come back from the lab after the reaction has moved on. All of them live in the Raman spectrum of the reaction mixture, read inline - in the reactor itself, continuously, with no sampling. Each is extracted by its own chemometric model, calibrated against your laboratory's reference values.
Laser excitation at 785 nm, with a 1064 nm variant for strongly fluorescing drying-oil alkyds. Spectral range 300-1650 or 300-3500 cm⁻¹ at 8 cm⁻¹ resolution.
A single acquisition takes from 5 s. The reaction trajectory becomes a live curve instead of a titration every 30-60 minutes.
AI and advanced chemometrics in Spectrally OS, a CNN core reading the full spectrum - trained on your resin matrix and your recipes, not a generic library calibration.
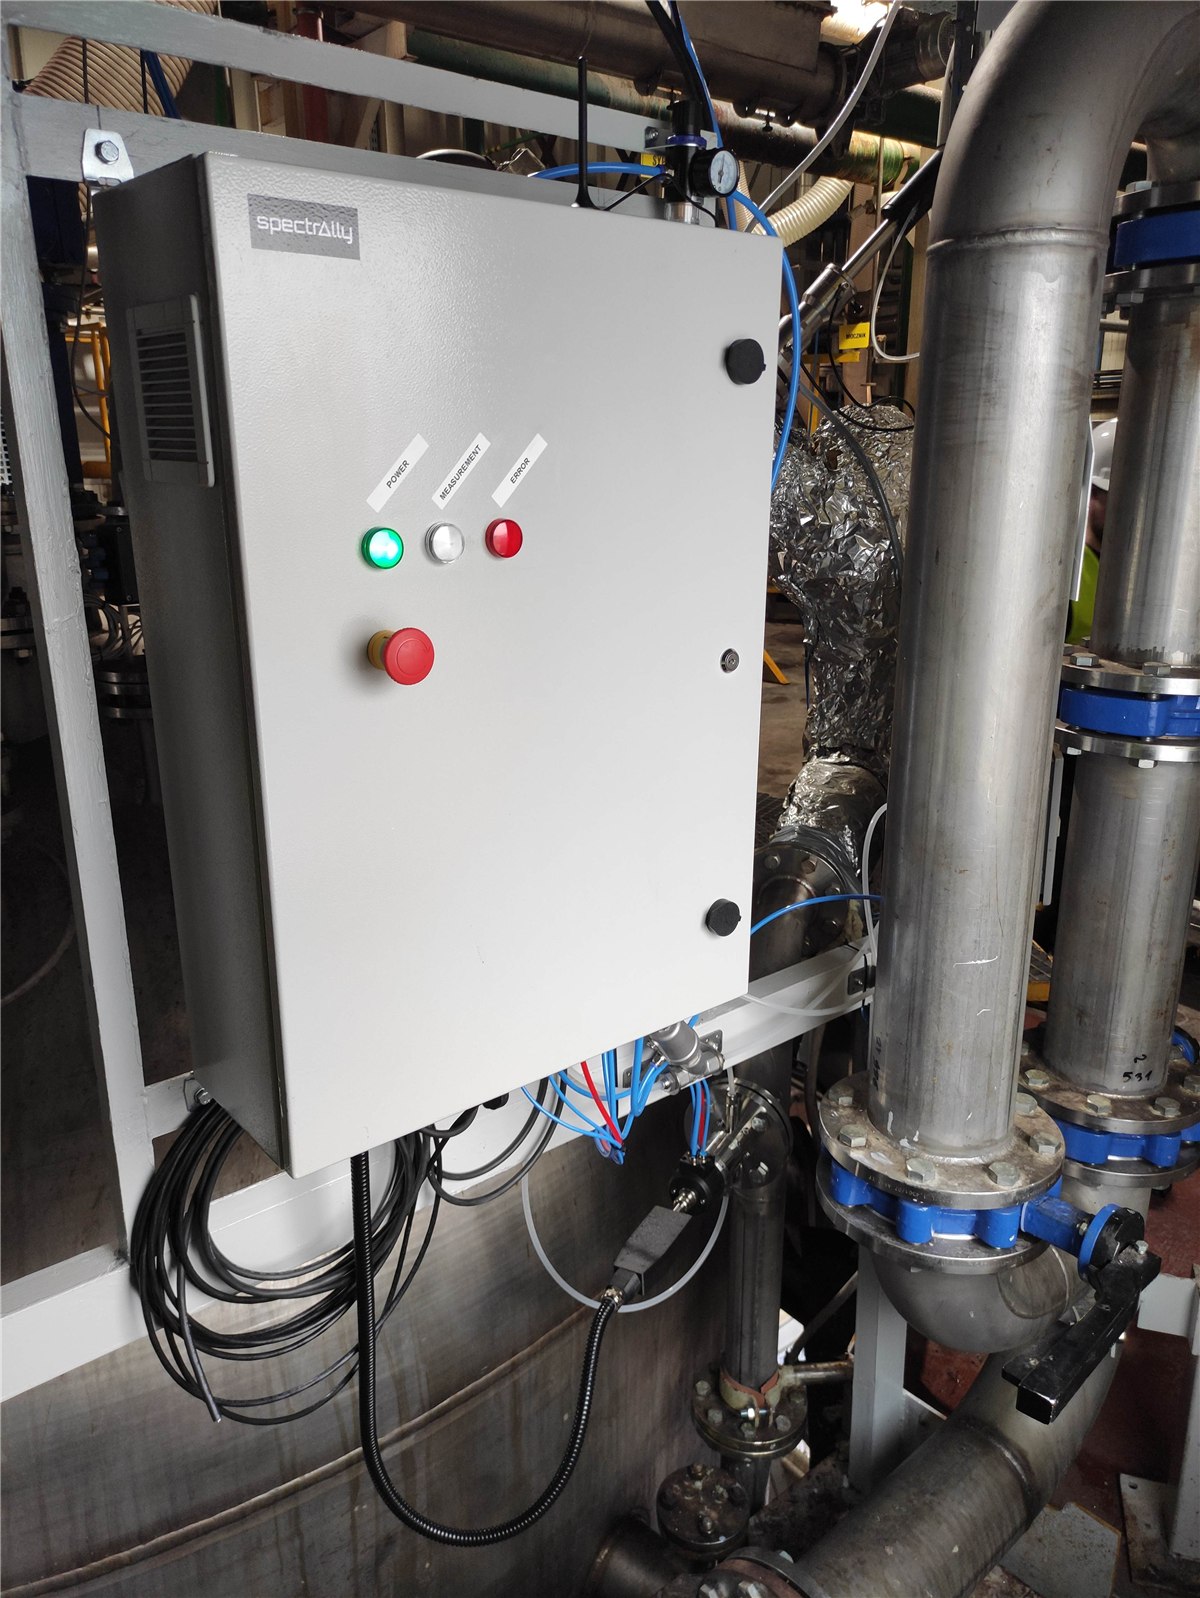
Values arrive in the PLC / DCS over PROFIBUS and PROFINET. Every measurement is stored and exportable as CSV, PDF or raw spectra.
The values that decide when the reaction is done.
Each value is pulled straight from the Raman spectrum by a dedicated chemometric model. Select a parameter to see where it sits on the spectrum.
Acid value - the esterification endpoint for alkyds.
In alkyd and polyester resins, the acid value is the endpoint the whole cook is steered toward. Spectrally reads it inline from the ratio of the acid and ester carbonyl (C=O) bands near 1710 and 1730 cm⁻¹.
Why it decides the batch
Acid value fixes where the esterification is stopped. Variable reaction kinetics from batch to batch of drying oil make that point hard to predict, and every overshoot means a solvent correction or an off-spec batch.
How it is read today
Titration to ISO 3682: 30-60 minutes, and it requires stopping the reactor and pulling a sample by hand from a medium above 220 C. Offline viscometry adds only a proxy for progress.
What reading it inline changes
The acid value comes off the spectrum in real time, with no sampling. It has no single dedicated band, so a CNN model links the whole Raman spectrum to the value, built on the acid/ester carbonyl band ratio. Feasibility on real alkyd resin: model vs lab R 0.982-0.998, mean absolute error about 0.015 mg KOH/g.
Hydroxyl value - the complementary group, tracked through the cook.
The hydroxyl value runs alongside the acid value as the second functional-group handle on the resin, followed through the process from the same spectrum.
Why it decides the batch
Together with the acid value, the hydroxyl value sets the functionality and the downstream crosslinking behaviour your customer formulates around. Reading both from one spectrum keeps the two in step through the reaction.
How it is read today
Wet-chemical titration on a pulled sample, offline and after the fact - the same lab loop that already gates the acid value, run a second time.
What reading it inline changes
The hydroxyl value is tracked continuously from the same acquisition that returns the acid value - one probe, one spectrum, both functional-group values on the same live curve.
Viscosity endpoint - stop on data, not on the clock.
The viscosity build is the classic alkyd endpoint signal, and it is read live from the same Raman spectrum as the acid value - no separate instrument, no separate sample.
Why it decides the batch
The condensation has to be stopped at the right viscosity: too early and the resin is under-built, too late and it gels in the reactor. Between viscometry readings, crews bridge the gap with time and temperature - habit standing in for a measurement.
How it is read today
Offline rotational viscometry on a pulled sample - an indirect proxy for reaction progress that says nothing about composition, and lands minutes after the state it describes.
What reading it inline changes
Viscosity is inferred from the Raman spectrum alongside composition. Feasibility on real resin during synthesis: R 0.988-0.998 against the reference method - a live endpoint read, so the reactor stops on the measured endpoint instead of a conservative time margin.
Monomer conversion - safety and quality in one number.
In acrylic resins and emulsions, monomer conversion and residual monomer come straight off the disappearing C=C monomer band - a single value that carries both the reaction endpoint and the VOC and odour question.
Why it decides the batch
Residual monomer is a quality issue - VOC and odour - and a regulatory one, while copolymer composition sets Tg and coating properties. Conversion is the number that closes the polymerization.
How it is read today
GC for residual monomer at 30-60 minutes, GPC / SEC for the molecular-weight distribution at 60-120 minutes - both offline, both well behind the reactor.
What reading it inline changes
Conversion is read continuously from the C=C monomer band against the polymer bands, so the emulsion or solution batch is driven to its endpoint in real time instead of confirmed an hour later by GC.
%Solids / NVM - composition, not a single index.
Non-volatile matter is one of the first numbers a customer reconciles on the certificate. Read continuously from the spectrum, it becomes a running value rather than a single refractometer point.
Why it decides the batch
Solids define the grade. They have to hold consistent from batch to batch and from plant to plant, and every downstream dilution and dosing step assumes they do.
How it is read today
A single refractometer reading, or a gravimetric NVM check offline - one number, taken once, with no view of how the batch got there.
What reading it inline changes
%Solids / NVM comes off the same spectrum as acid value and viscosity - one probe, several parameters, all from the same instant in the batch. The refractive index becomes a cross-check instead of the only inline number you have.
Emulsion consistency - grade-to-grade repeatability you can prove.
For acrylic emulsions, the value a customer feels is consistency: the same grade behaving the same way, batch after batch. The full-spectrum fingerprint makes that repeatability provable.
Why it decides the batch
An emulsion that drifts grade to grade shows up downstream as inconsistent film formation and coating properties. Consistency is the property the grade is sold on.
How it is read today
Reconstructed after the fact from a handful of offline checks - solids, viscosity, residual monomer - each on its own sample and its own clock.
What reading it inline changes
The whole Raman fingerprint is logged continuously through the batch, so grade-to-grade repeatability is documented on hundreds of measurements rather than inferred from a few end-of-batch samples.
What comes off your critical path.
None of these methods disappears. They move from real-time gatekeeper to periodic verification - and the endpoint decision stops waiting for them.
See these six parameters read on your own resin.
Send representative samples or R&D data from your alkyd, acrylic or composite-resin process. We build and validate the chemometric model on your matrix and report exactly which of the six parameters inline Raman reads on your reactor, and how accurately. On alkyd acid value the models track the laboratory to R 0.982-0.998 at about 0.015 mg KOH/g, with viscosity from the same spectrum at R 0.988-0.998.